
Article written by: Amanda Hunter & Tracey P. Lauriault
The Organisation for Economic Co-operation and Development (OECD) recently published a policy response to COVID-19 in which they suggest that open science, and the policies & standards that support it, can accelerate the health, social, and economic responses to the virus as barriers to information access are eliminated.
As the first in a series of blog posts about Open Science (OS) and FAIR principles in Canada, here we highlight the key role open science plays in communicating and disseminating official COVID-19 research and public health data before assessing if official COVID-19 reporting in Canada adheres to OS principles.
In a next post, we will analyze official COVID-19 reporting in Canada to assess whether or not these follow Open Science, FAIR principles, and the Open Data Charter in the sharing of COVID-19 data.
What is Open Science?
The OECD Open Science program states that the benefits of open science is that it promotes a more accurate verification of scientific results, reduces duplication, increases productivity, and promotes trust in science.
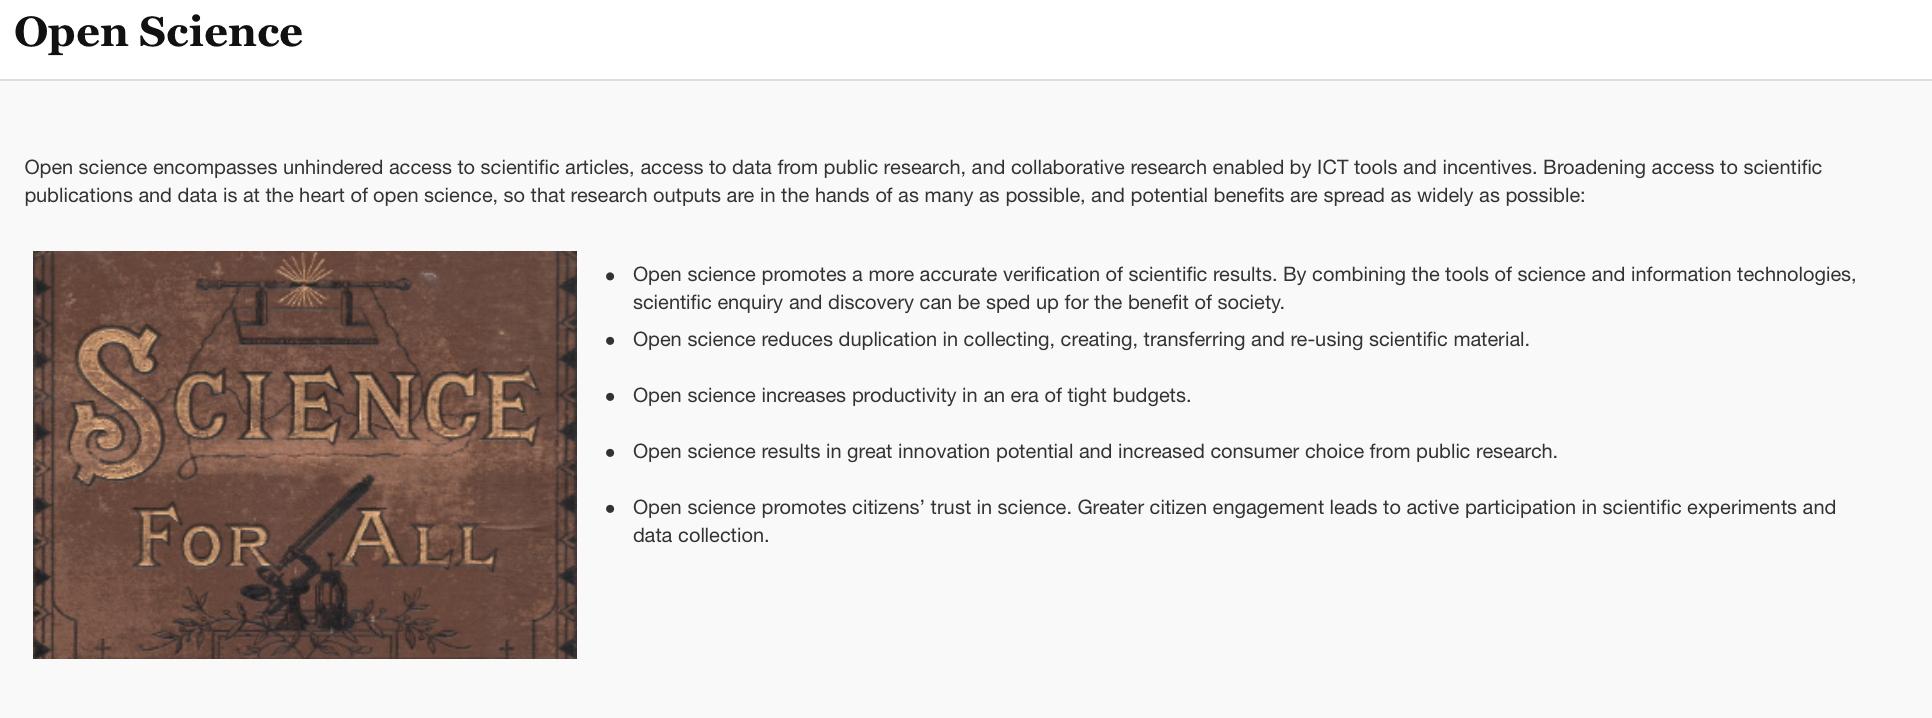
Open science (OS) is a movement, a practice and a policy toward transparent, accessible, reliable, trusted and reproducible science. This is achieved by sharing how research and data collection are done so as to make research results accessible and standardized, created once and reused by many. This includes techniques, tools, technologies, and platforms should also be open source wherever possible.
In OS the outputs of the scientific process are considered to be a public good, thus wherever possible articles are published in open access (OA) journals, and research data are shared with the public and other scientists who may want to re-purpose those data in new work, or by people who want to verify the veracity of research results. Reporting COVID-19 Cases by normalizing an open by default approaches means that health scientists, population health experts and government officials make this part of their workflow (maintaining individual privacy of course), and by doing so decision makers beyond government, can scrutinize the results, leading to trust the results while also increasing data sharing.
What role does open science play in combating COVID-19?
In the early stages of the pandemic, knowing the genome provided crucial information to help scientists and researchers identify the origin of the outbreak, treat the infection, develop a diagnostic test and work on the vaccine. In other words, the easier—and quicker—researchers can produce, share and access scientific data, the quicker and the more informed is the collaborative response to the virus.
During the 2002-03 SARS outbreak it took five months to publish a full genome of the virus largely due to information blackouts and lack of data sharing. In contrast, the full genome of COVID-19 was published to an open-access platform nearly a month after the first patient was admitted to the hospital in Wuhan. This provided researchers around the world with a head start. Since OS policies have been operationalized during the pandemic, the resulting free flow of ideas in terms of biomedical research has accelerated (OECD).
The implementation of OS standards during COVID-19 has indeed been largely successful. OECD described how collaborative research and thee global sharing of information reached unprecedented levels, for example:
- In March 2020, 12 countries (including Canada) launched the Public Health Emergency COVID-19 Initiative at the level of Chief Science advisors, calling for open access to publications and machine-readable access to data related to COVID-19.
- Open online platform Vivli offers an easy way to request anonymized data from clinical trials.
- A COVID-19 Open Research Dataset [CORD-19] was developed that hosts 157,000 + scholarly articles about COVID-19 and related coronaviruses; 75,000 of which are full-text machine-readable data that can be used for AI and natural language processing.
These online, open-source platforms have supported rapid scientific COVID-19 research. OS, facilitated by standards, shared infrastructure and techniques, policies and licences, has been instrumental in the global fight against the pandemic.
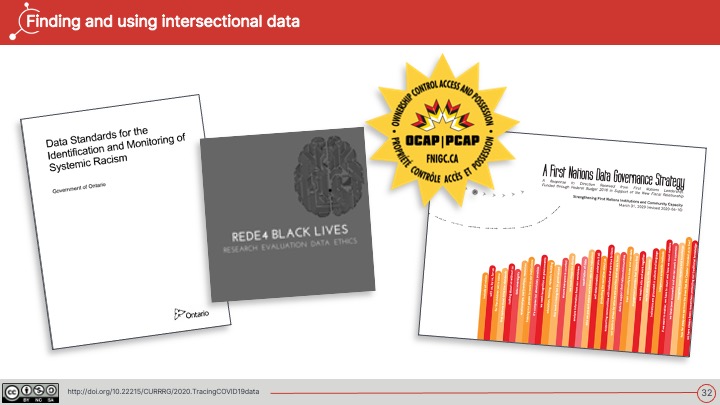
Yet, despite the numerous successes, many challenges remain. For example, not all COVID-19 related health research and data adhere to the FAIR principles. FAIR principles are a standards approach which support the application of open science by making data Findable, Accessible, Interoperable, and Reusable. Failure to adhere to FAIR principles has led to an overall lack of communication and coordination during the pandemic. In Canada, data should also adhere to CARE principles, which address issues of Indigenous data governance with respect to Indigenous knowledge along with the OCAP Principles of the First Nation Information Governance Centre (FNIGC). More on this in the following section.
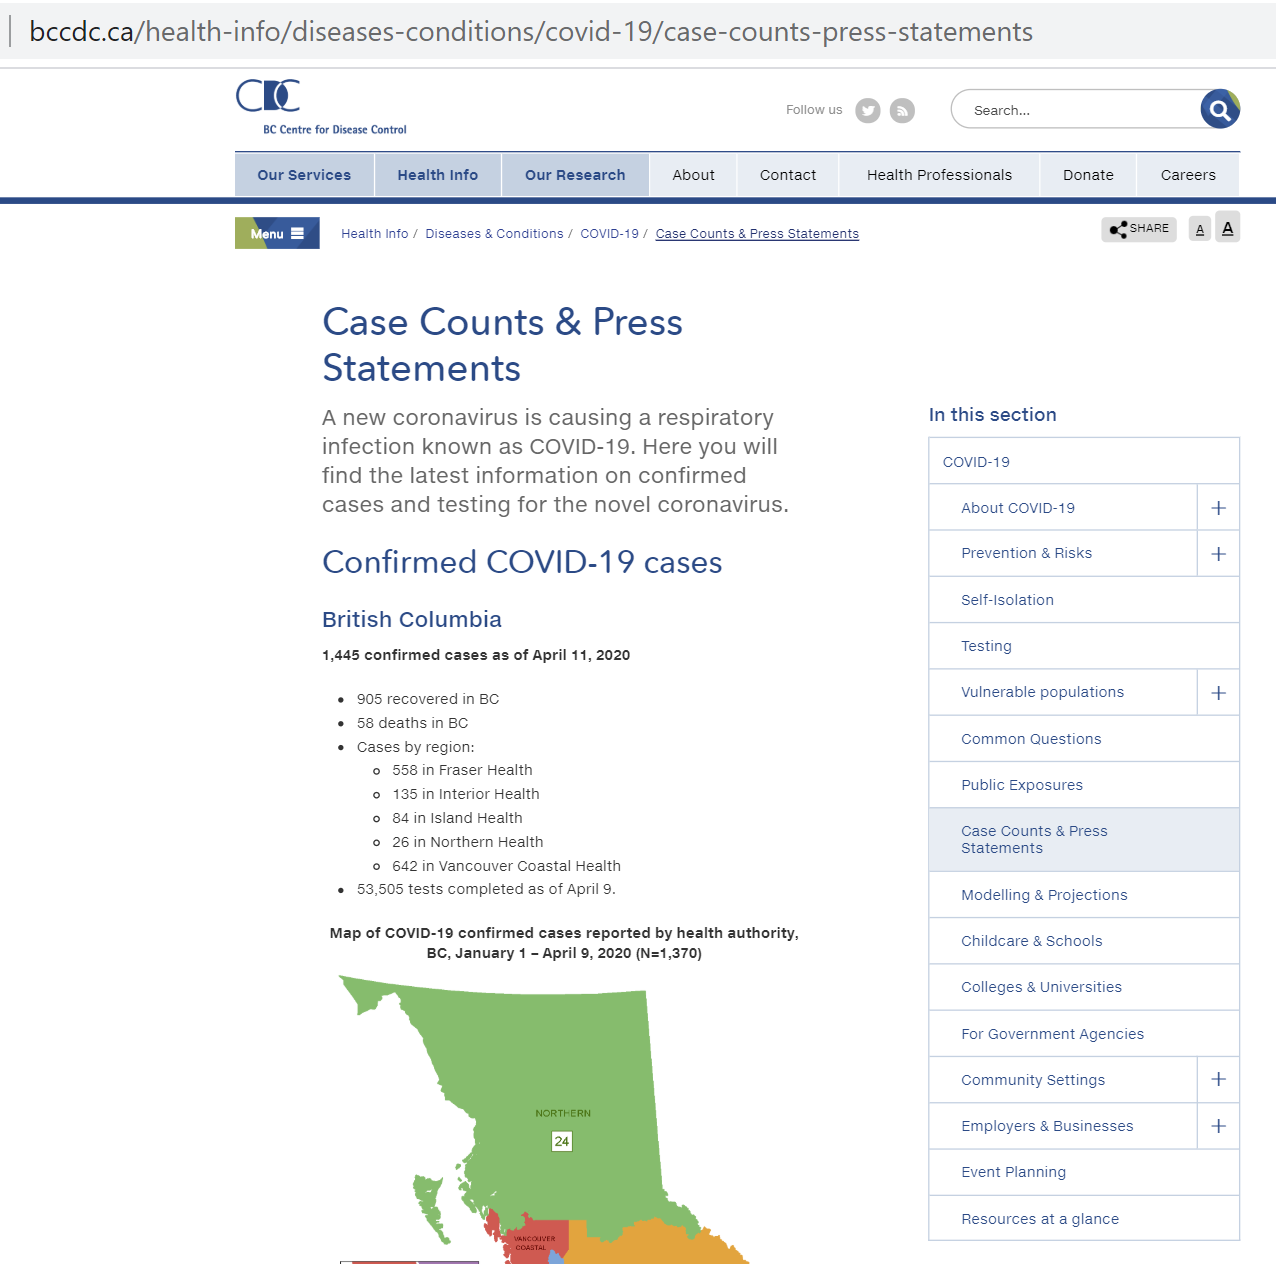
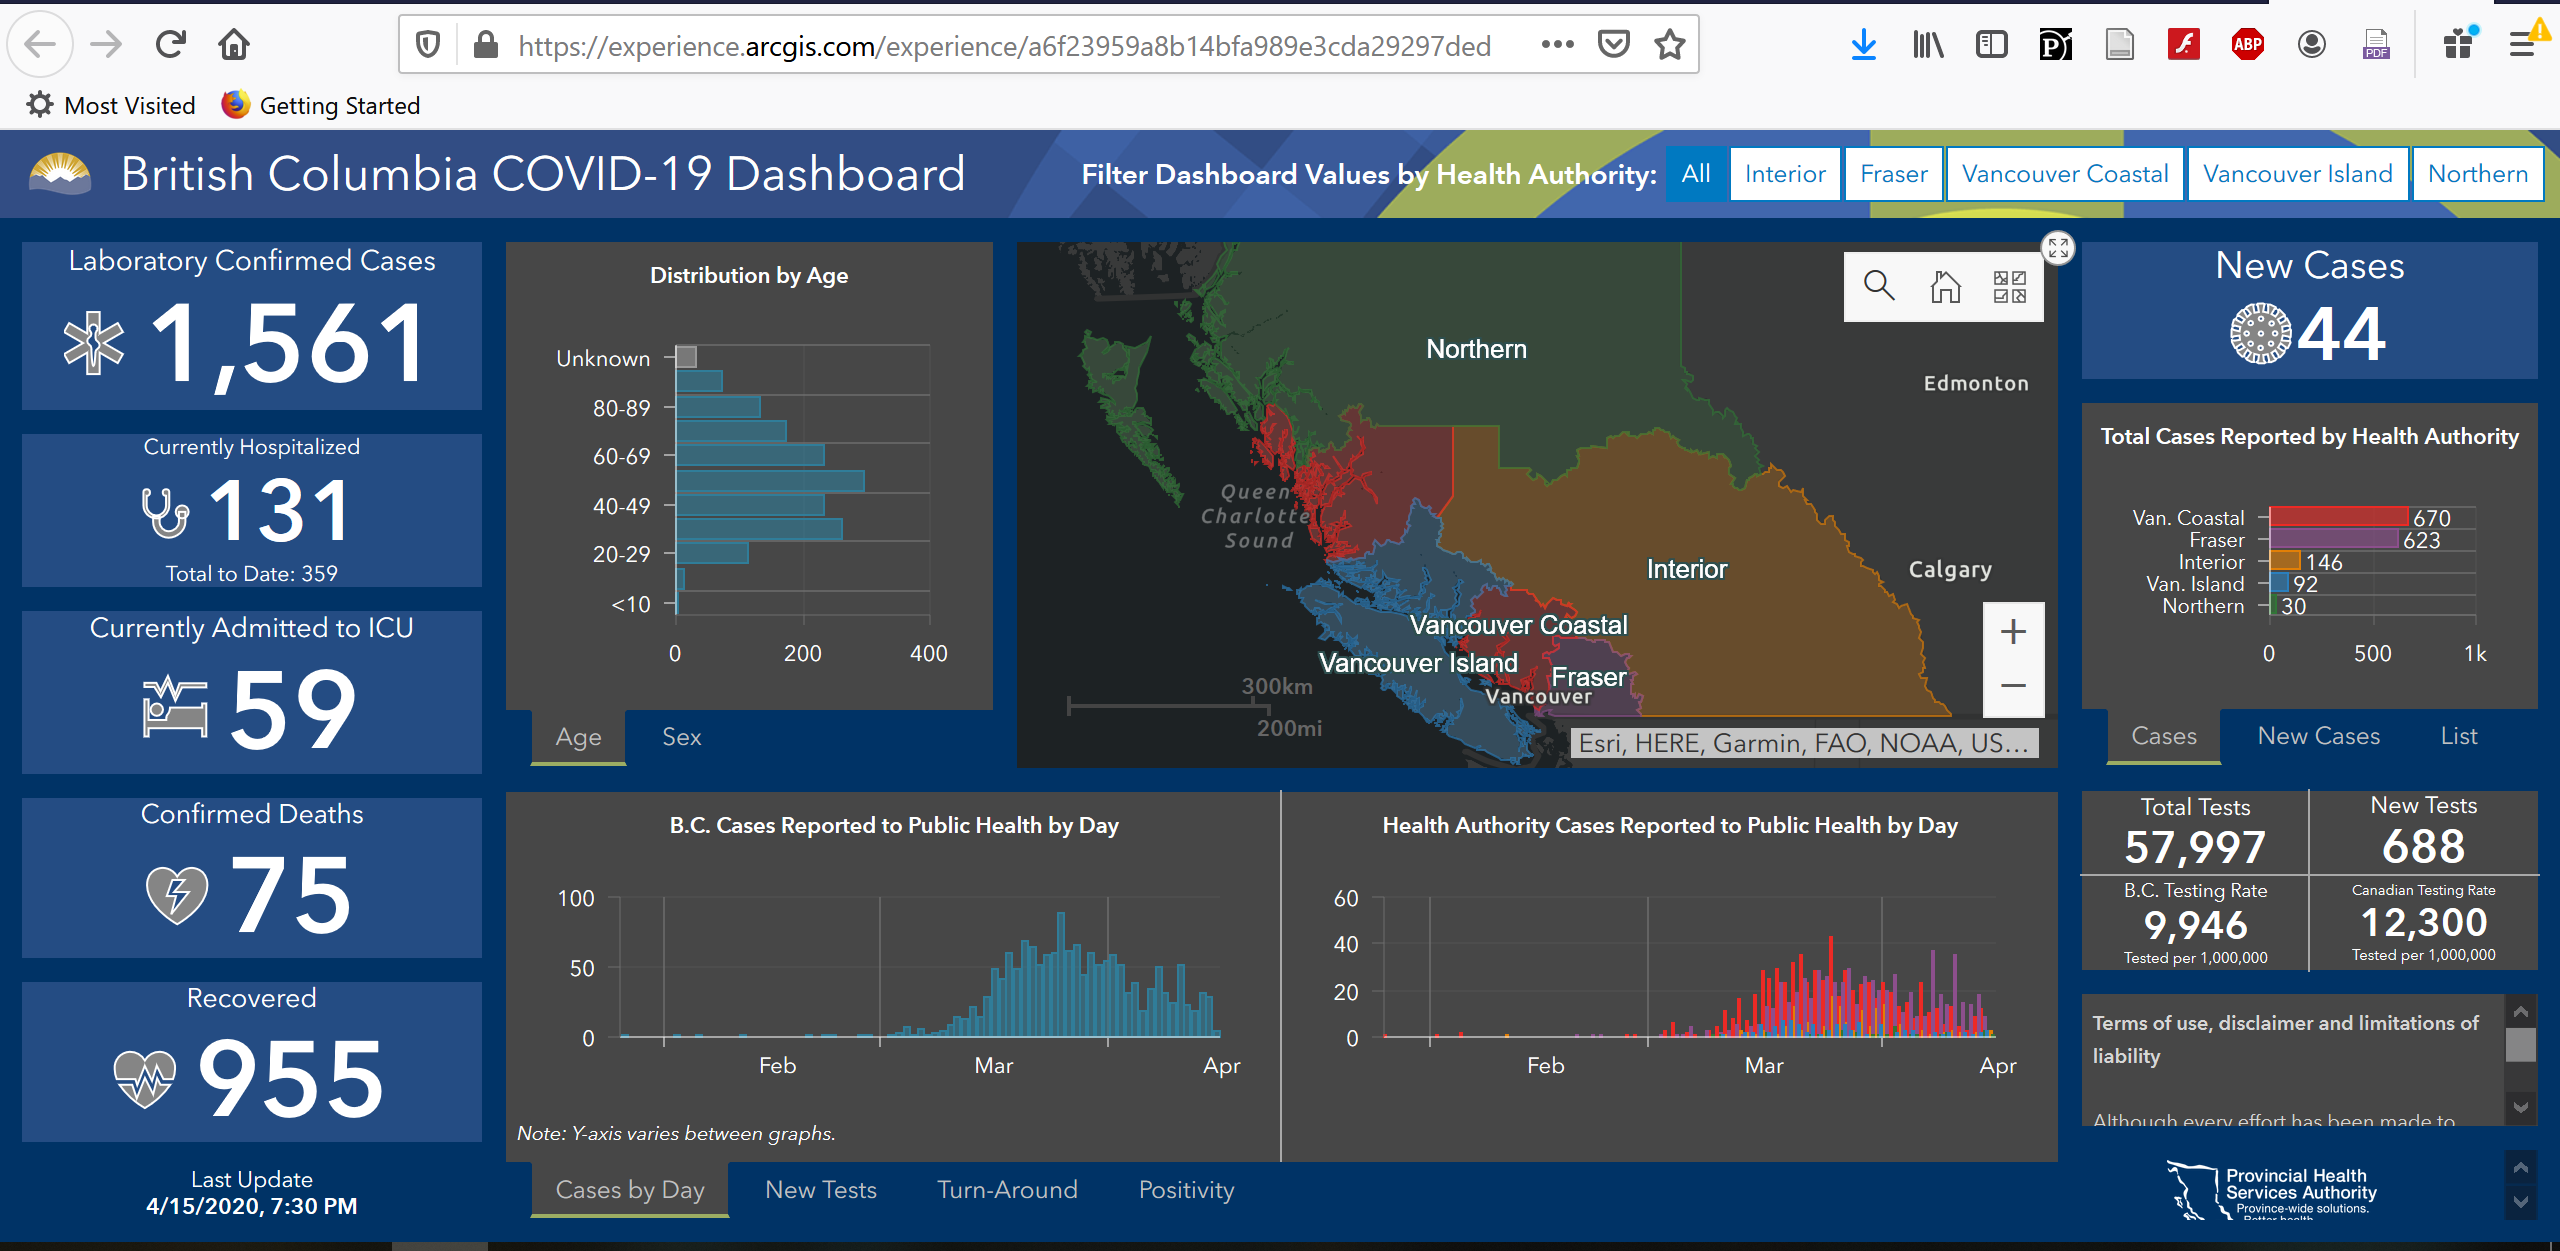
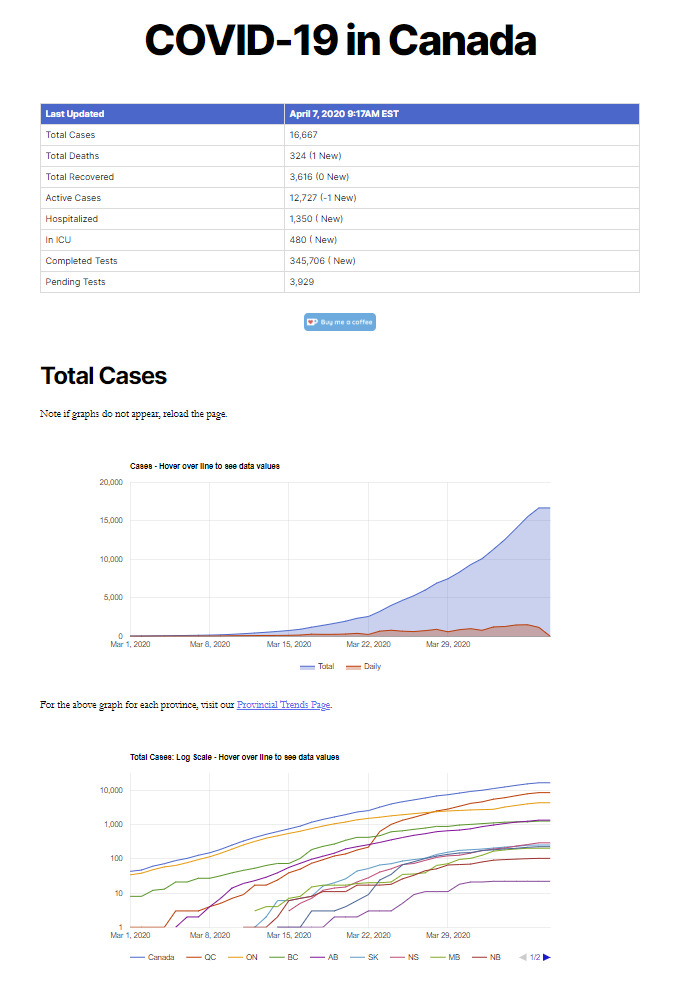
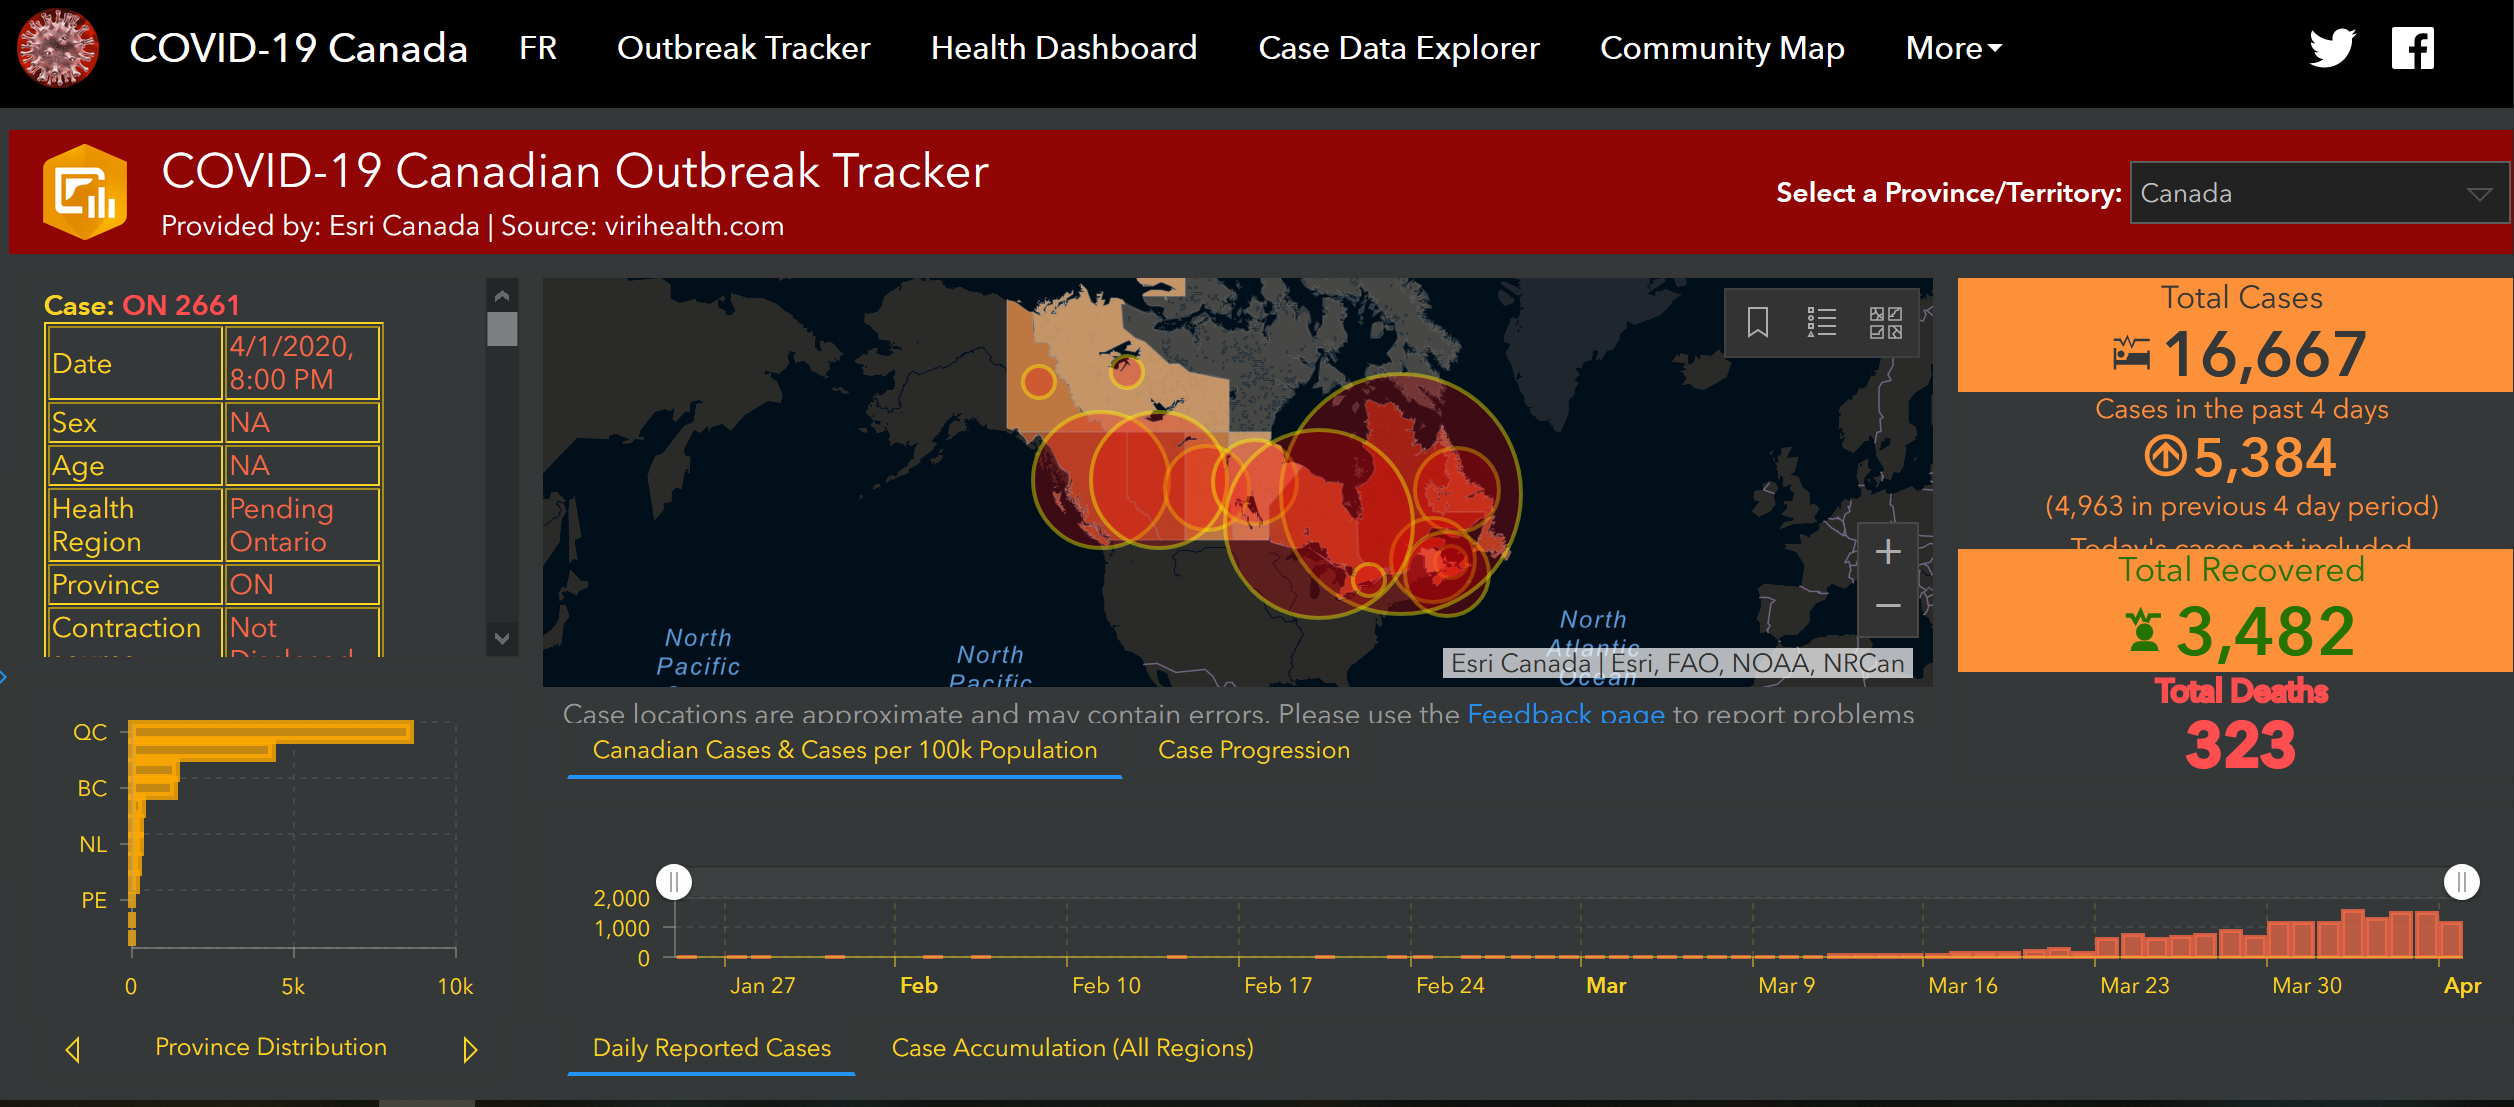
The reporting COVID-19 demographic data and reports in Canada to date falls short on standardized classifications in terms of demographics, as we discussed in an earlier blog post, which makes doing a comparative analysis difficult or impossible: for example, many countries define “recoveries” differently, and in Canada, since health is the jurisdictional responsibility of the provinces and territories, each report in their own way. Even though numerous official organizations publish COVID-19 and health related data, as open data databases or in open data portals, there remains an overall lack of interoperability, comparability and standards.
Where does Canada stand on Open Science?
Canada was implementing an open science framework before the pandemic as follows.
National Action Plan on Open Government
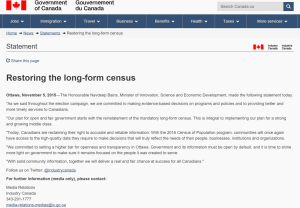
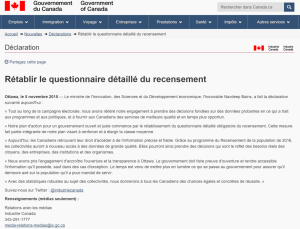
The Government of Canada recently published Canada’s 2018-2020 National Action Plan on Open Government, listing ten commitments to furthering the open government initiative. The plan asserts five commitments to implementing OS in Canada by the end of 2020, as seen below:
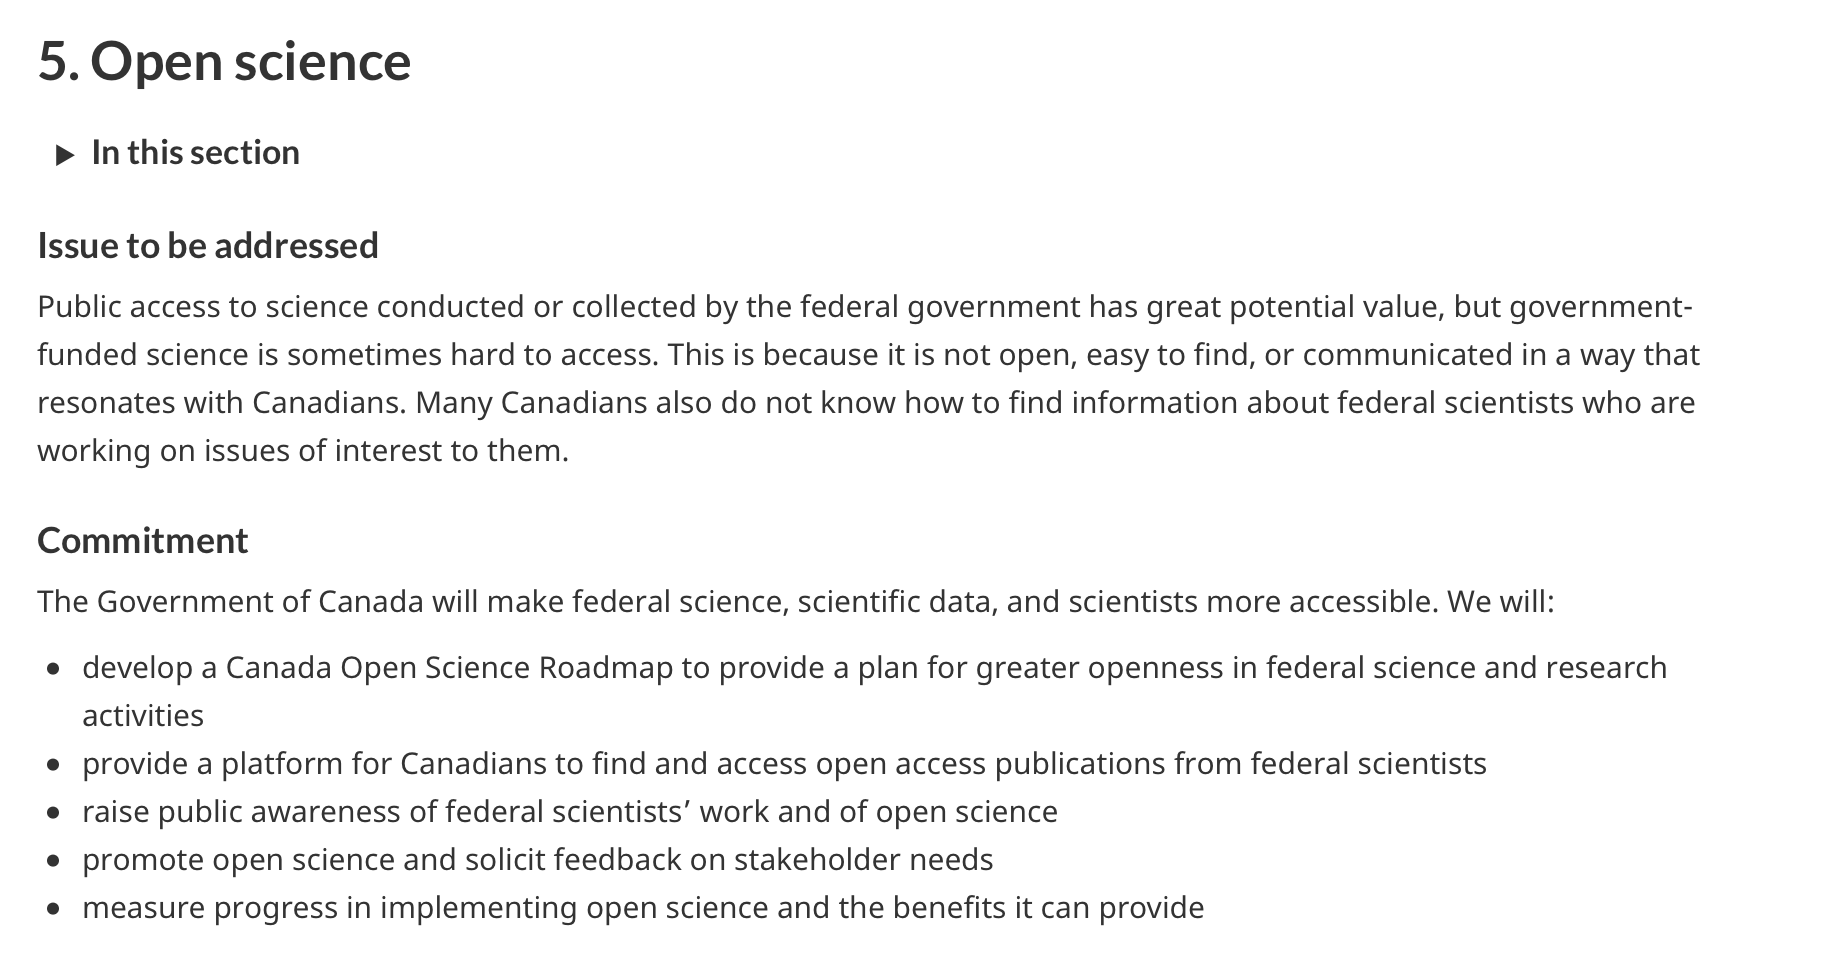
The OS portion of Canada’s 2018-2020 National Action Plan on Open Government. It aims to address the difficulty for Canadians to access scientific research: thus the commitments on making federal science, scientific data, and scientists themselves more accessible (Government of Canada, 2018).
The Action Plan addresses issues of accessibility and transparency of scientific research and outlines 5 commitments to amending these issues. These commitments include:
- Development of an OS roadmap,
- Providing an open access platform for publications,
- Raising awareness of federal scientists’ work,
- Promoting OS and soliciting feedback on stakeholder needs, and
- Measuring progress & benefits of the OS implementation.
Despite the comprehensiveness of the Roadmap (see below), Canada has not yet moved past the Action Plan’s second commitment—to provide a platform for Canadians to find and access open access (OA) publications from federal scientists—despite the projected March 2020 deadline. Also, at the time of writing, there is no federal open science platform or portal for users to access open science data in Canada even though there is an open data portal. The New Digital Research Infrastructure Organization (NDRIO) does show promise.
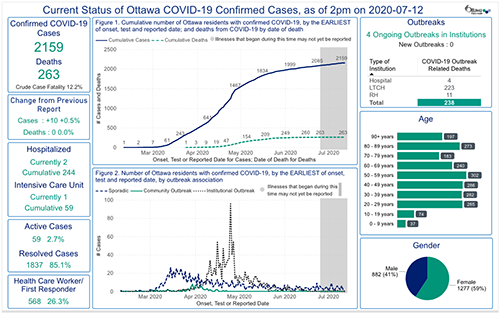
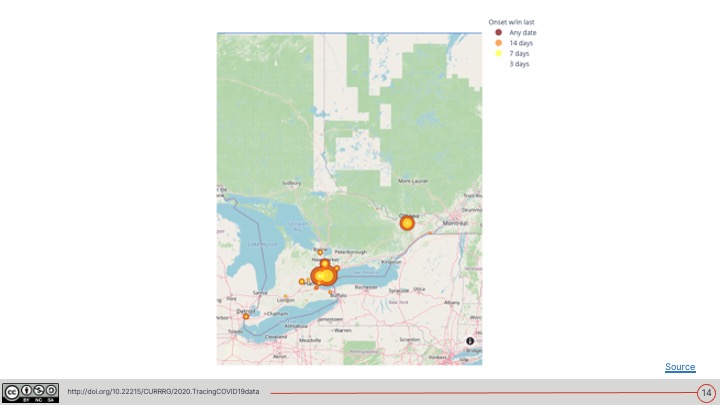
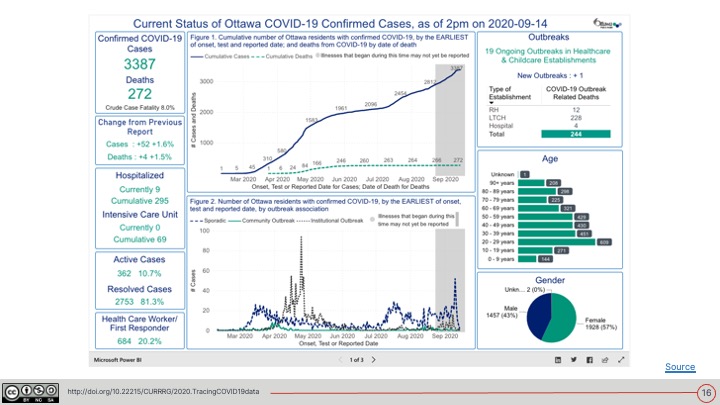
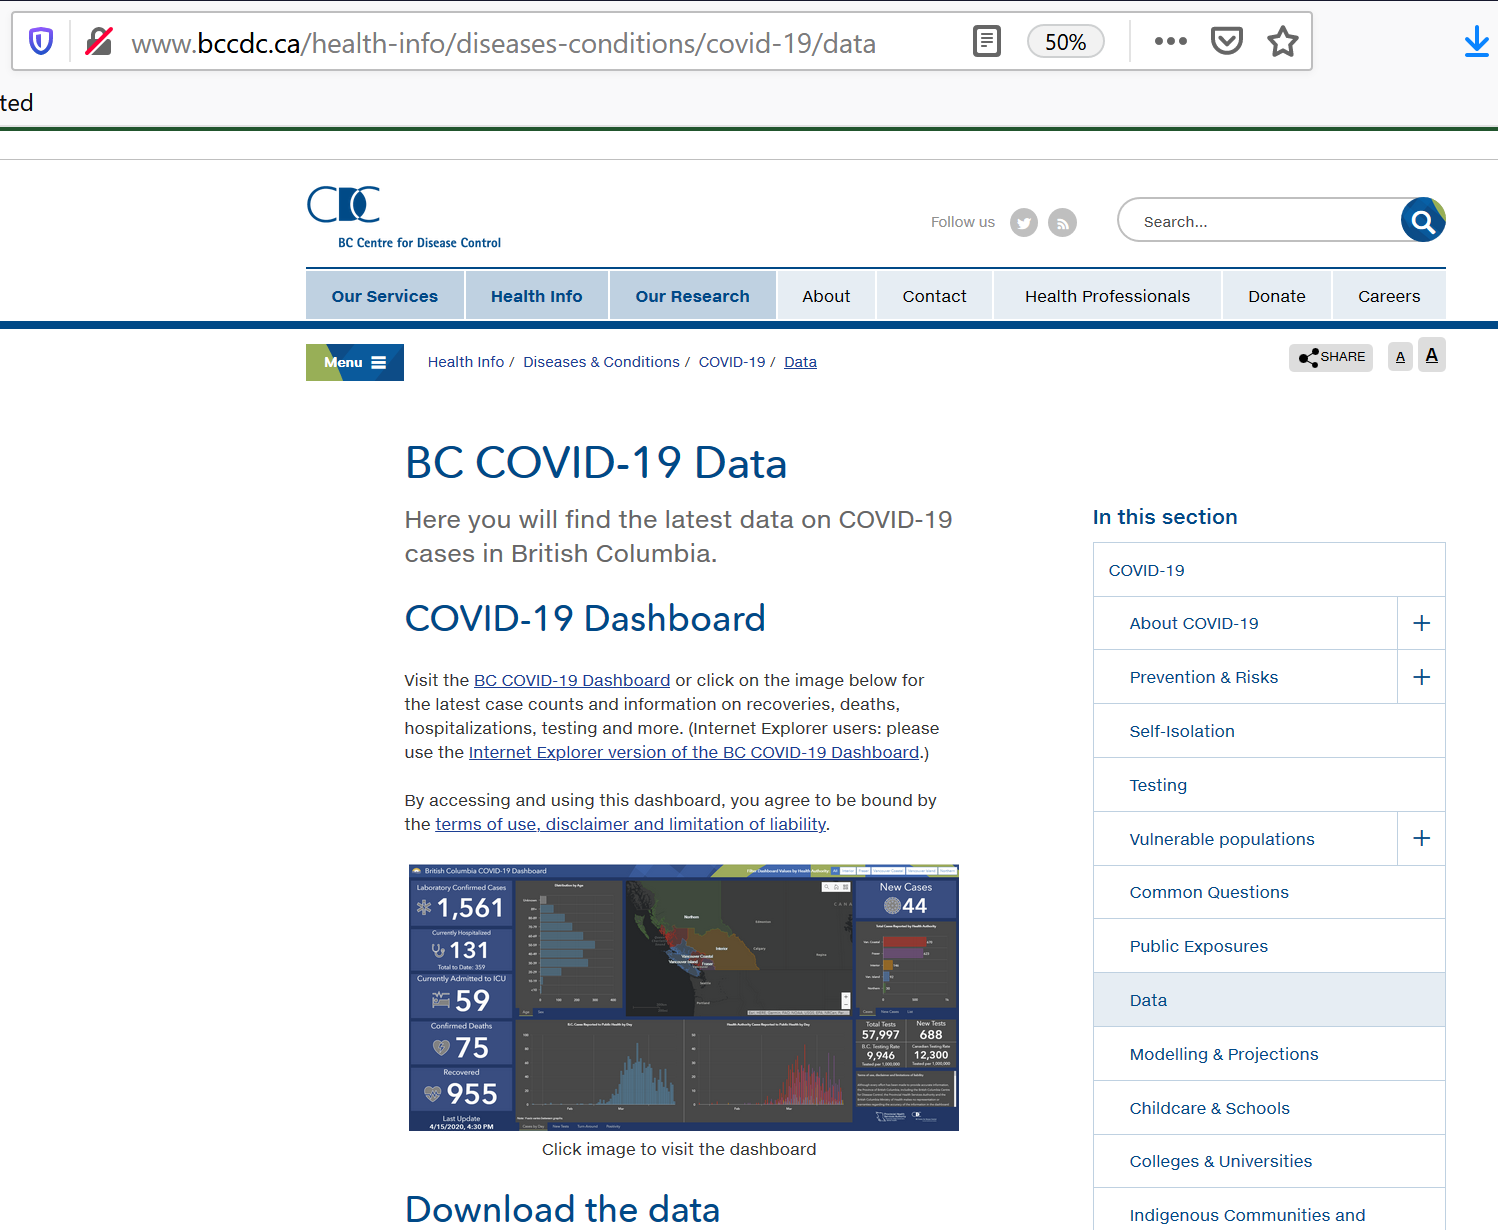
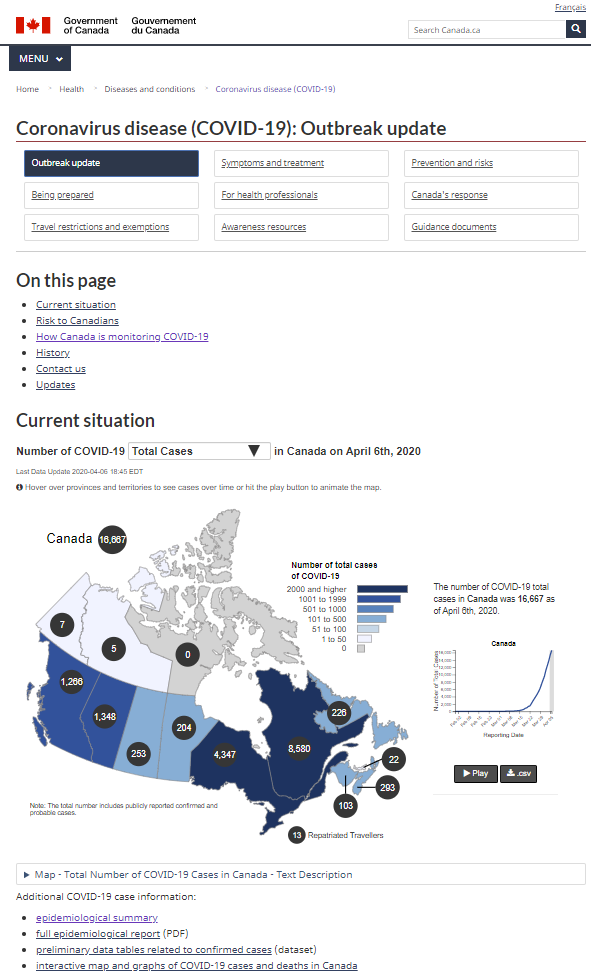
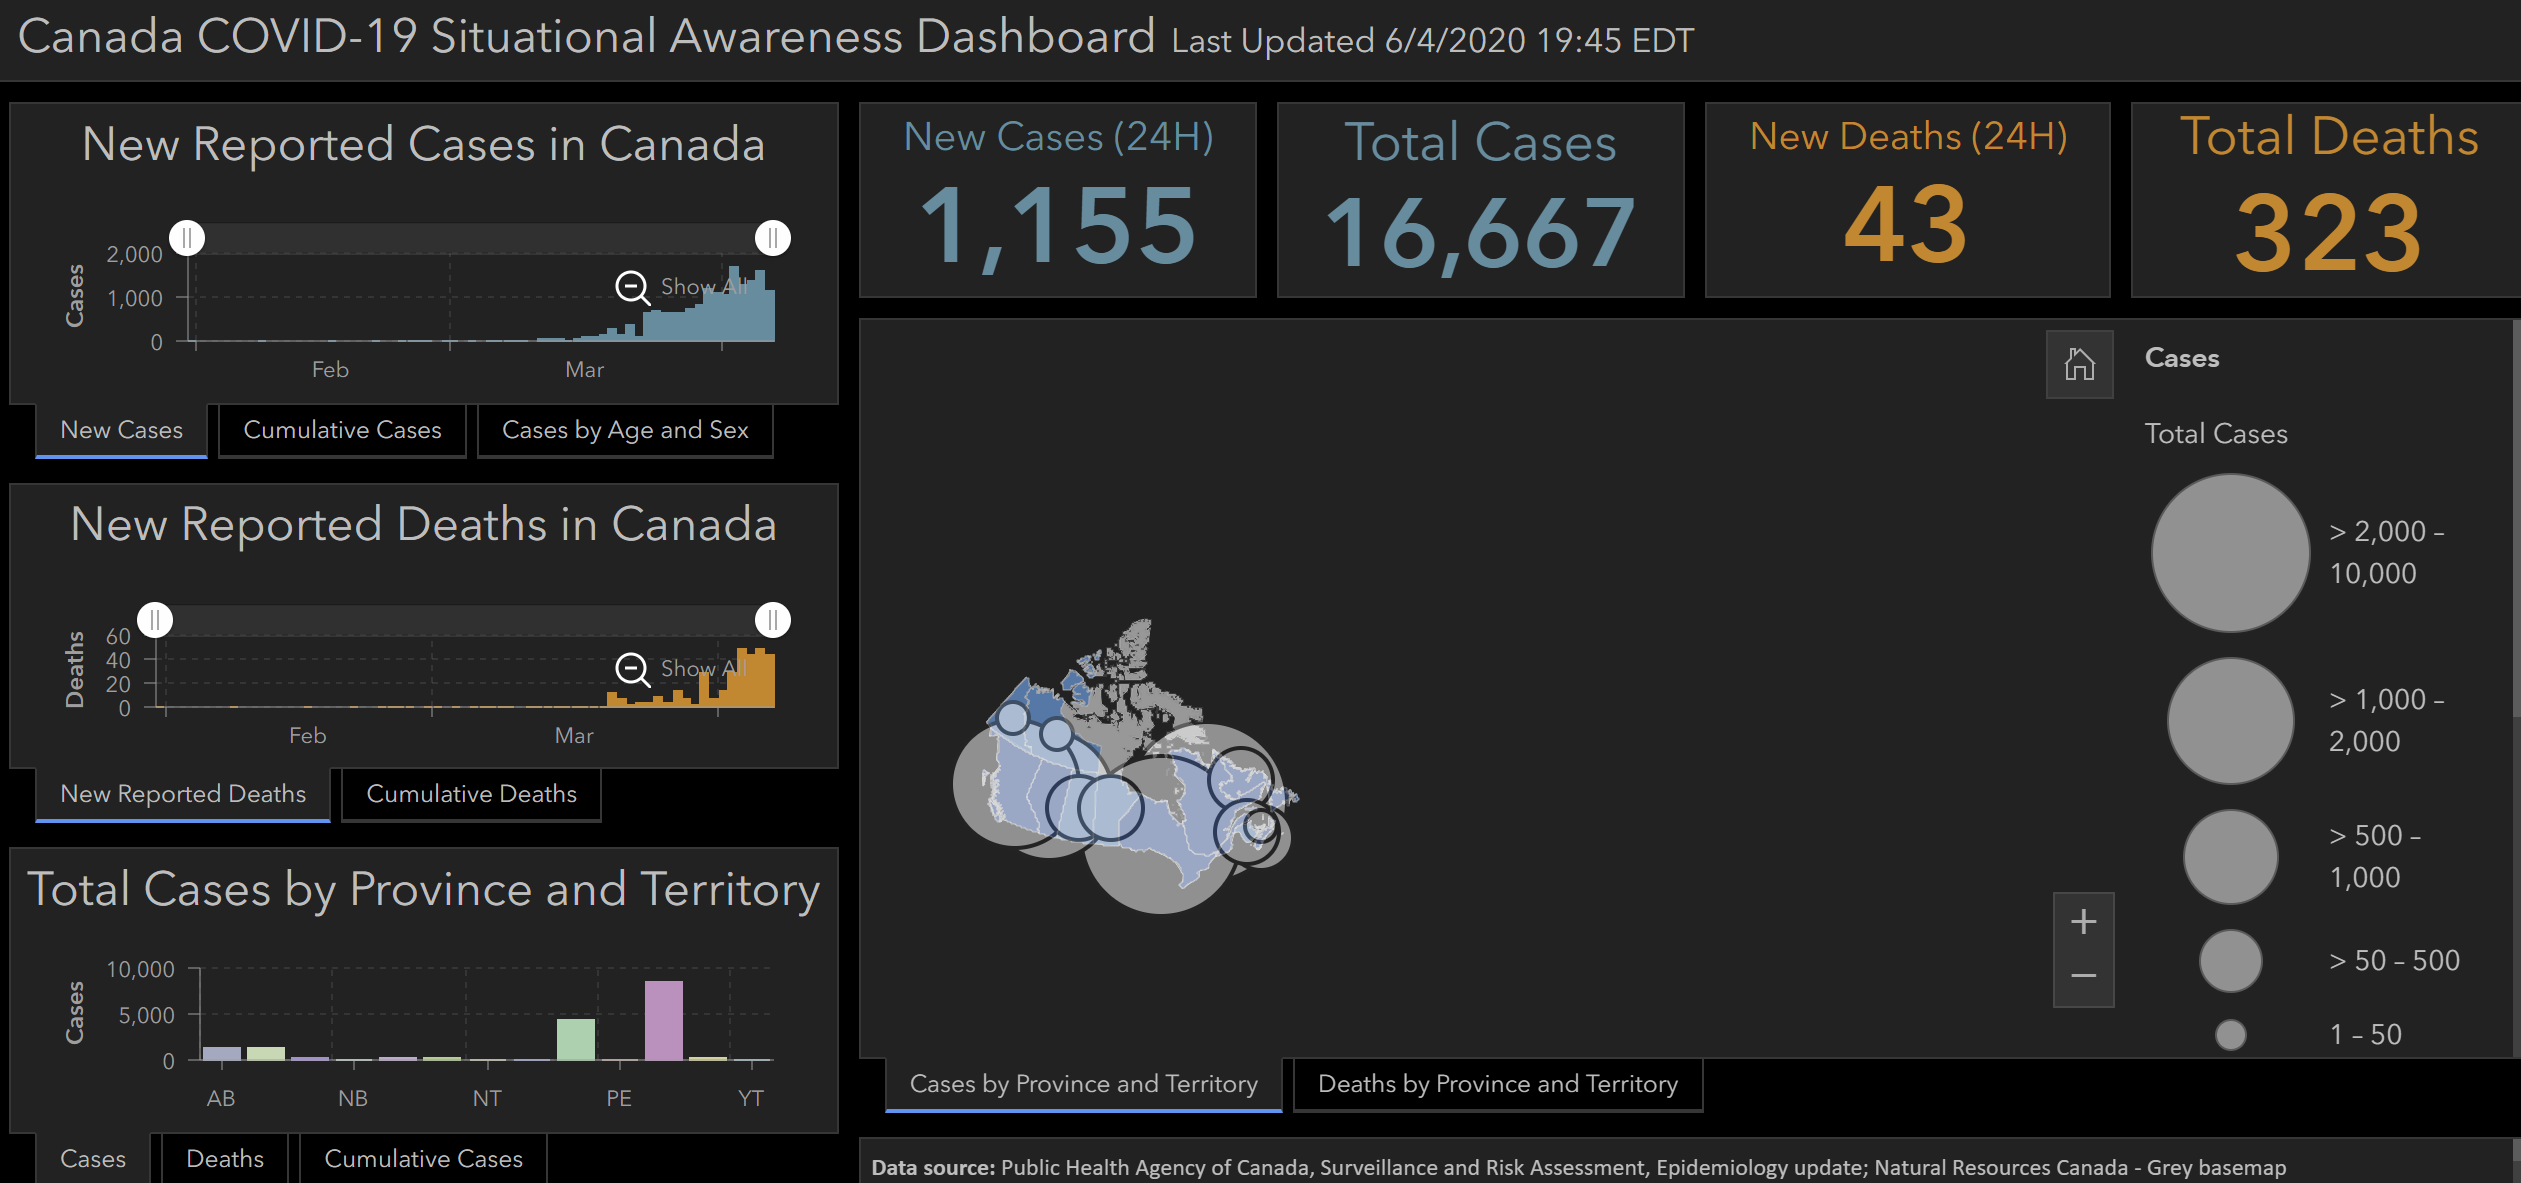
There are however some open data initiatives, such as the Federal Open Government and COVID-19 section on the Open Government Canada Portal. Here Epidemiological and economic research data, with mathematical modeling reports, a map of cases and deaths by province, daily and weekly detailed epidemiological reports, and an ongoing dataset of COVID-19 cases, deaths, recoveries, and testing rates in Canada’s provinces and territories are made available. This is a significant improvement from the early days of reporting, as data journalist Kenyon Wallace discovered that on a daily basis, the Province of Ontario published new data but each time they did they overrode the previous day’s reports. His article and some work by Lauriault with the Ontario Open Government team resulted in changing that practice and raw data are now updated daily and reported. Open data is but one part of the OS process as we will see when we look at the FAIR principles.
Open Science Roadmap
The plan’s first commitment, to “develop a Canada Open Science Roadmap…” was completed and published in February 2020. The document provides ten recommendations made by Chief Science Advisor, Dr. Mona Nemer, to advance Canada’s OS initiatives. Like the policy brief by OECD, the roadmap is driven by the importance of trust among collaborators, inclusiveness of varying perspectives, and transparent processes throughout.
Canada’s Roadmap for Open Science (Government of Canada, 2020)
Most importantly, the Roadmap describes a commitment to developing an OS framework, including adopting the FAIR principles and “open by design and by default” specifications. The roadmap asserts Canada’s commitment to upholding these standards and policies via 10 recommendations:
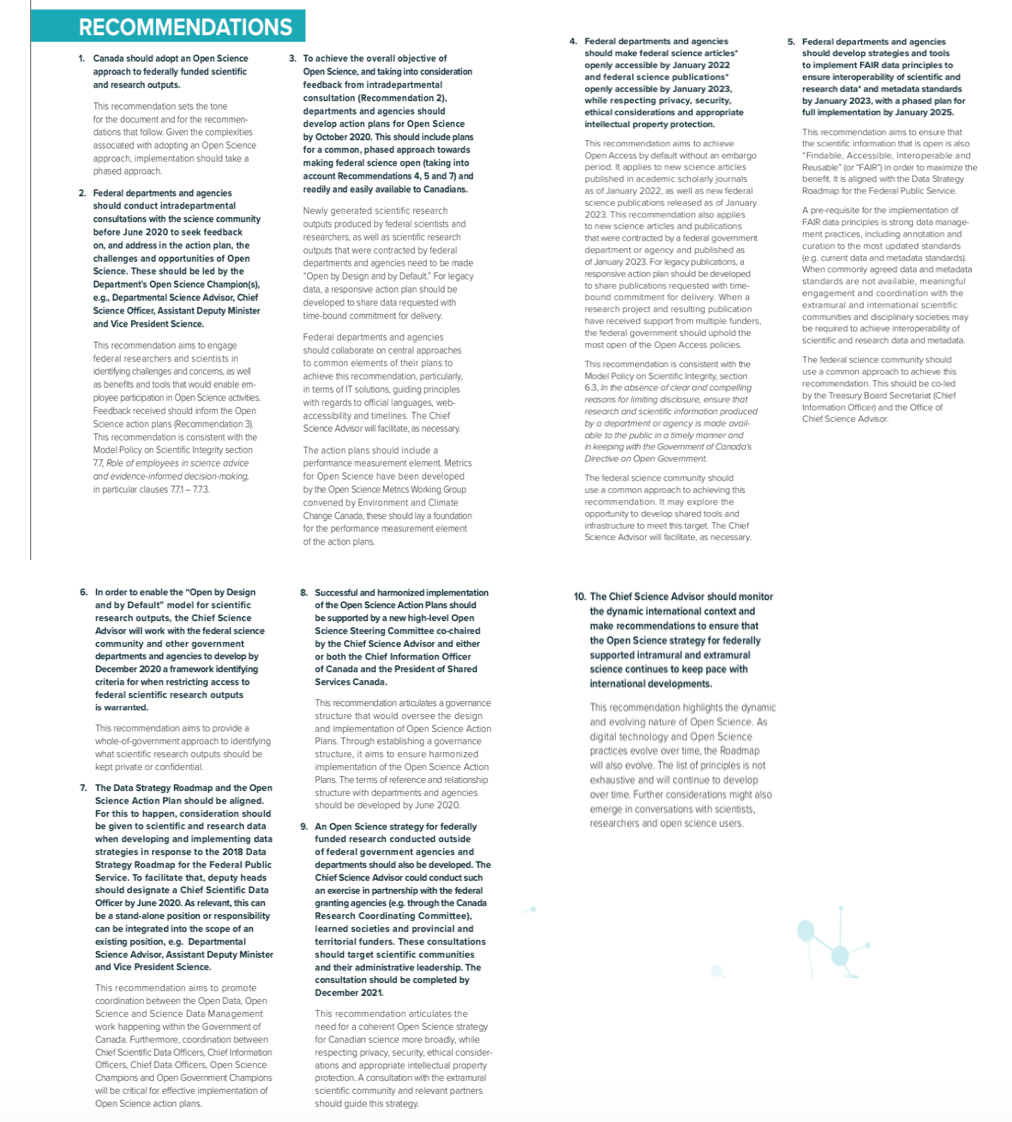
10 recommendations in the Roadmap for Open Science. Key points include the adoption of an OS framework, making federal scientific research outputs ‘open by default’, and implementing FAIR principles (Government of Canada, 2020).
Model Science Integrity Policy
Canada also has a Model Science Integrity Policy (MSIP) for the public service. The MSIP represents an internal commitment to integrity and accountability in science. Various mandates in the MSIP state that their purpose is to increase public trust in the credibility and reliability of government research and scientific activities, and ensure that research and scientific information are made available in keeping with the Government of Canada’s Directive on Open Government. The MSIP echoes Canada’s commitment to OS.
Indigenous Data Governance
Finally, Canada has some commitment to supporting Indigenous rights to self-determination and data governance, but does not incorporate standards such as CARE principles which support OS nor the OCAP Principles when it comes to Indigenous data governance. These extend the FAIR principles.
The Global Indigenous Data Alliance (GIDA) introduced the CARE principles to complement the FAIR principles in 2019. The CARE principles for Indigenous data governance were developed to address a lack of engagement between the open science movement and Indigenous rights and interests (GIDA, 2019).
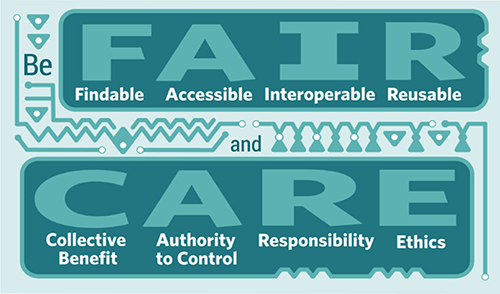
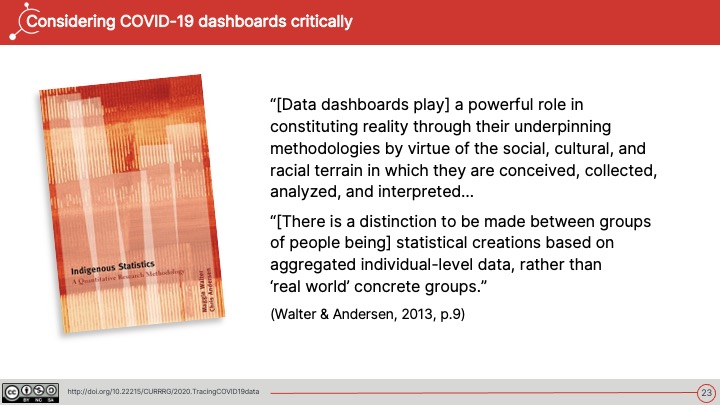
The FAIR principles focus on data accessibility of data and sharing but fail to address power differences and the impact of colonialism experienced by Indigenous peoples and their right to exercise control and ownership of data about them and local and traditional knowledge. The CARE principles are crucial for the recognition and advancement of these rights as they encourage open science (and other ‘open’ movements) to “consider both people and purpose in their advocacy and pursuits” (GIDA, 2019). The CARE principles are contrasted with the FAIR principles in the below image from the GIDA website:
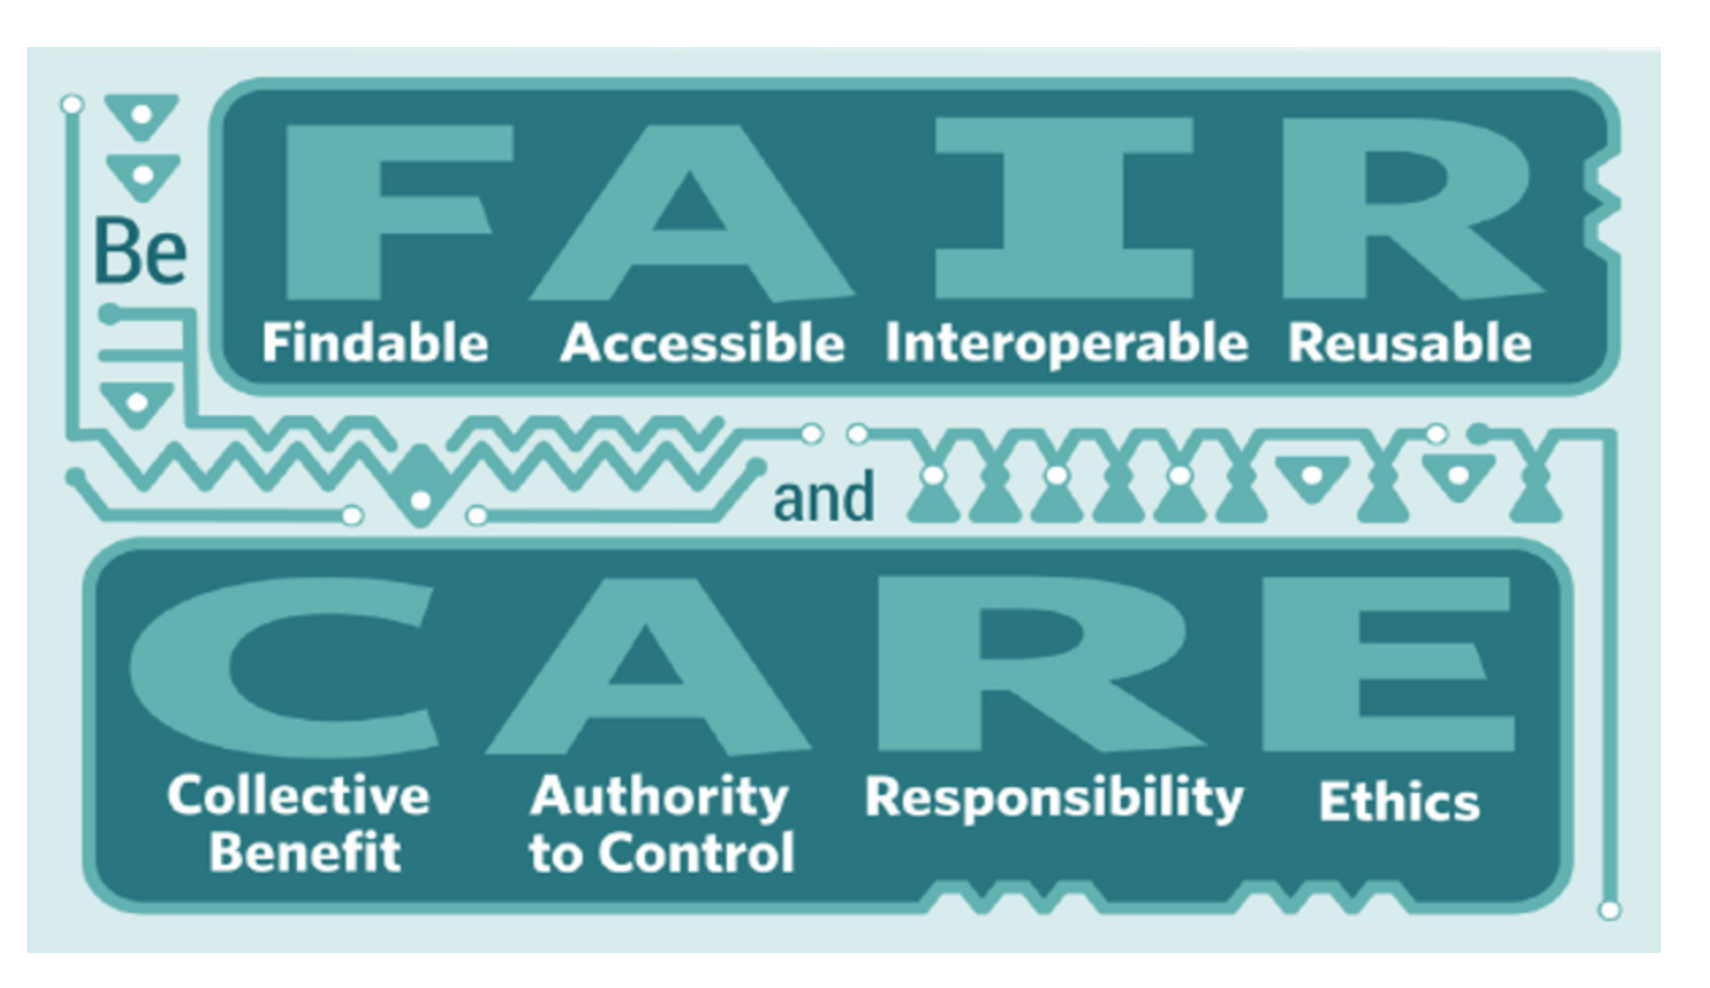
The CARE principles are “collective benefit, authority to control, responsibility, and ethics”, contrasted with the FAIR principles, which are “findable, accessible, interoperable, and reusable” (GIDA, 2019)
The OCAP Principles of Ownership, Control, Access and Possession are another set of important principles, that are a better fit in the Canadian Context. Members of our project currently taking the Fundamentals of OCAP course and we hope to better incorporate these approaches in our work and in how we assess official reporting. Though Indigenous data governance and handling of Indigenous knowledge are not addressed in the Open Science Roadmap, the Data Strategy Roadmap for the Federal Public Service does demonstrate a federal approach to supporting Indigenous data strategies (see below):
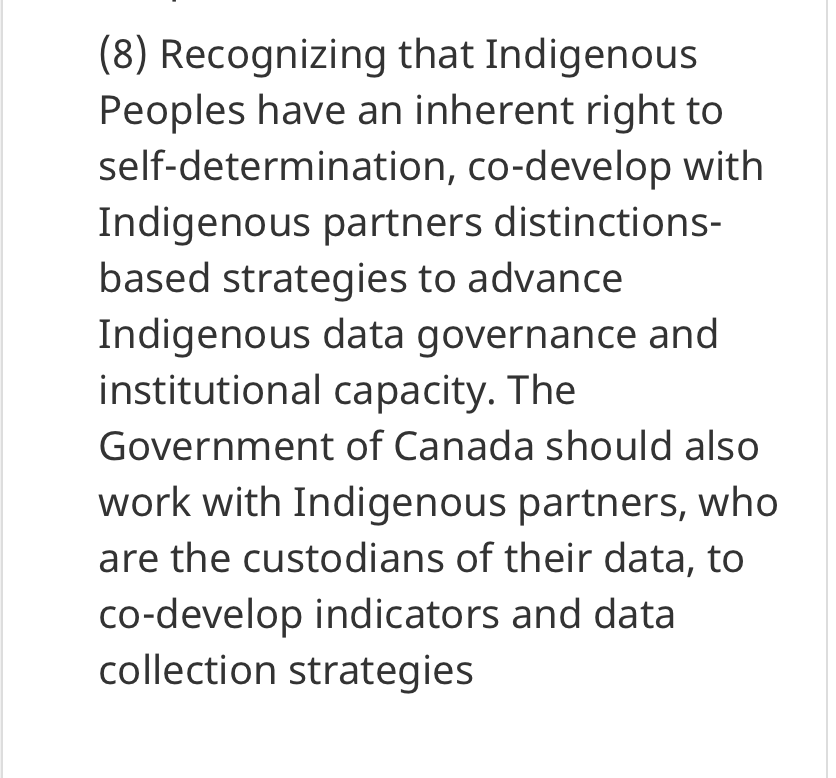
Recommendation #8 from the Data Strategy Roadmap for the Federal Public Service which states Canada’s recognition of the Indigenous right to self-determination and data governance (Government of Canada, 2019)
Next Steps
Much progress has been made in terms of publishing, reporting and communicating data in the short time since COVID-19 began (though not without pressure from the media!). Open access to scientific research and public health reports have been helpful to facilitate the rapid response to the virus and keeping the public informed on how science informs governments actions. There is, however, much left to be done.
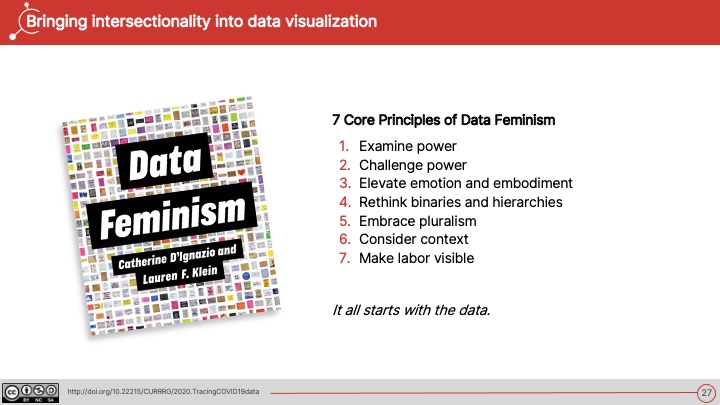
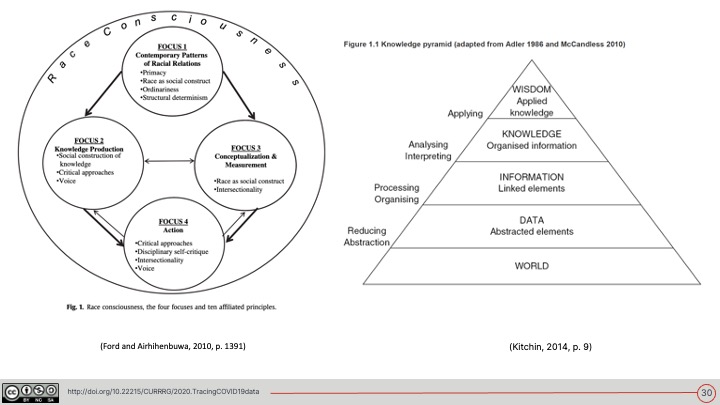
- Open Science should consider bias in data as well as invisibilities for example interdisciplinary work that helps paint the fuller picture of the impact of the virus. For example, interdisciplinary and intersectional approaches to data categories, including research based in critical race theory (CRT), Indigenous perspectives, socio-demographics and gig labour groups for example.
- Second, as suggested by the OECD, making COVID-19 data Findable, Accessible, Interoperable and Reusable is critical for a more effective rapid response. Lack of adherence to FAIR principles currently presents challenges to open science research.
- Finally, a meaningful Canadian OS framework should also incorporate standards for Indigenous Data Governance such as CARE Principles and OCAP Principles ensure respectful data practices are followed.
The Tracing COVID-19 Data team is in the process of developing a framework to assess official COVID-19 reporting in Canada to see if they comply with OS, FAIR, CARE, OCAP, and open-by-default at all levels of government. We will draw on Canada’s commitments OS and FAIR in – Canada’s 2018-2020 National Action Plan on Open Government, Open Science Roadmap, the Model Science Integrity Policy and the Open Data Charter.
Is Canada FAIR?
Stay tuned!
Recommendation
All official Federal, Provincial/Territorial and City public COVID-19 data reporting should be open data, open by design and by default, research should be published in open access (OA) Journals and should adhere to open science (OS) such as the FAIR principles , CARE Principles, OCAP Principles and the Open Data Charter.
References
Canadian Internet Policy and Public Interest Clinic. Open Data, Open Citizens? https://cippic.ca/en/open_governance/open_data_and_privacy
Centres for Disease Control and Prevention. (n.d.). SARS- Associated Coronavirus (SARS-CoV) Sequencing. https://www.cdc.gov/sars/lab/sequence.html
CTVNews. (2020). Project Pandemic: Reporting on COVID-19 in Canada.
https://www.ctvnews.ca/health/coronavirus/project-pandemic
Federated Research Data Repository. (2018). FAIR Principles.
https://www.frdr-dfdr.ca/docs/en/fair_principles/
Global Indigenous Data Alliance. (2019). CARE Principles for Indigenous Data Governance.
https://www.gida-global.org/care
Government of Canada. (2014). Directive on open government.
https://www.tbs-sct.gc.ca/pol/doc-eng.aspx?id=28108
Government of Canada. (May, 2016). Open by default and modern, easy to use formats.
https://open.canada.ca/en/content/open-default-and-modern-easy-use-formats
Government of Canada. (2017). Model policy on scientific integrity.
https://www.ic.gc.ca/eic/site/063.nsf/eng/h_97643.html
Government of Canada. (2018). Canada’s 2018-2020 National Action Plan on Open Government. https://open.canada.ca/en/content/canadas-2018-2020-national-action-plan-open-government#toc8
Government of Canada. (2018). Report to the Clerk of the Privy Council: A Data Strategy Roadmap for the Federal Public Service. https://www.canada.ca/content/dam/pco-bcp/documents/clk/Data_Strategy_Roadmap_ENG.pdf
Government of Canada. (2020). Coronavirus disease (COVID-19): Outbreak update.
https://www.canada.ca/en/public-health/services/diseases/coronavirus-disease-covid-19.html?utm_campaign=not-applicable&utm_medium=vanity-url&utm_source=canada-ca_coronavirus
Government of Canada. (2020). Office of the Chief Science Advisor. https://www.ic.gc.ca/eic/site/063.nsf/eng/h_97646.html
Government of Canada. (2020). Open Government Portal.
https://open.canada.ca/data/en/dataset
Lauriault, T. (2020, April 17). Tracing COVID-19 Data: COVID-19 Demographic Reporting. Datalibre.
https://www.datalibre.ca/2020/04/17/covid-19-demographic-reporting/
National Centre for Biotechnology Information. (2020). Public Health Emergency COVID-19 Initiative.
https://www.ncbi.nlm.nih.gov/pmc/about/covid-19/?cmp=1
Open Data Charter. (n.d.). The International Open Data Charter.
https://opendatacharter.net
Organisation for Economic Co-operation and Development. (2020, May 12). OECD Policy Responses to Coronavirus (COVID-19): Why open science is critical to combatting COVID-19.
http://www.oecd.org/coronavirus/policy-responses/why-open-science-is-critical-to-combatting-covid-19-cd6ab2f9/
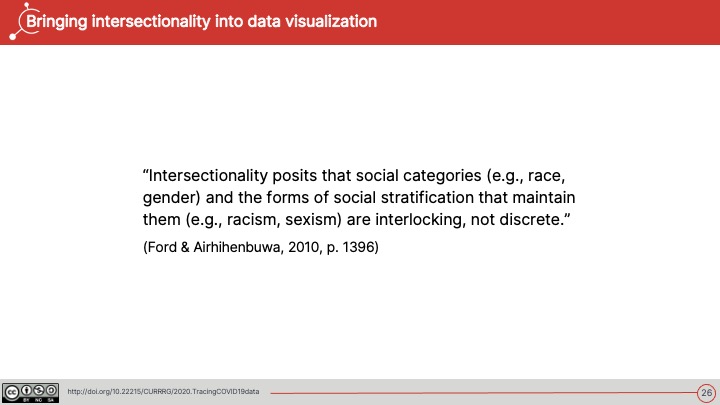
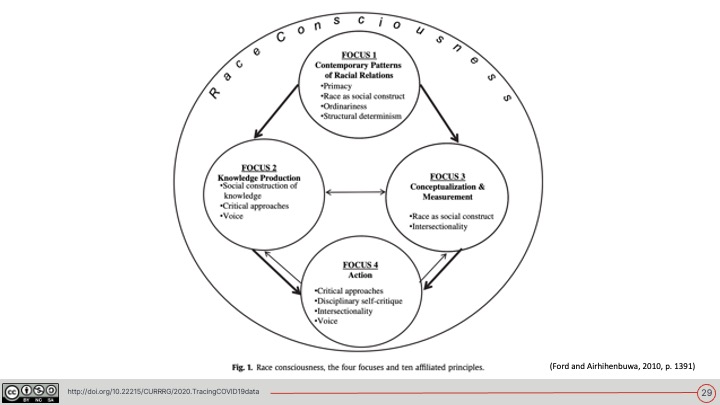
Ford & Airhihenbuwa. (2010). The public health critical race methodology: Praxis for antiracism research. Science Direct.
https://www.sciencedirect.com/science/article/abs/pii/S0277953610005800#!
Semantic Scholar. (2020). CORD-19: COVID-19 Open Research Dataset.
shorturl.at/wETZ5
The Lancet. (January, 2020). Genomic characterization and epidemiology of 2019 novel coronavirus: implications for virus origins and receptor binding.
https://www.thelancet.com/journals/lancet/article/PIIS0140-6736(20)30251-8/fulltext
The National Academies of Science, Engineering, Medicine. (2018). Open Science by Design: Realizing a Vision for 21st Century Research. Chapter 1, Front Matter.
https://www.nap.edu/read/25116/chapter/1
The Star. (2020). Coronavirus & COVID-19 Data. https://www.thestar.com/coronavirus/data.html
Vivli. (2020).
https://vivli.org/about/overview-2/


Comments on Posts