Uncategorized

You are currently browsing the archive for the Uncategorized category.

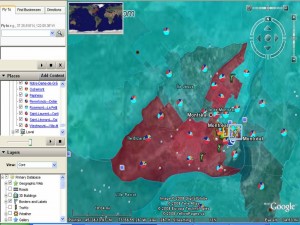
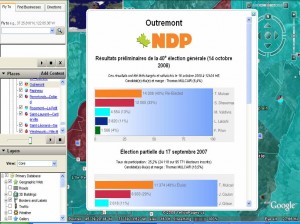
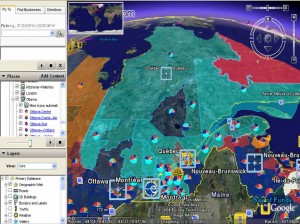
This is really interesting way to look at the election results.  Cédric, developed this excellent interactive Elections 2008 Mashup which uses the GeoGratis.ca Electoral Boundary file and the Elections Canada CSV data files of the results for the 38th, 39th and 40th elections and validated some of the data with information from Parliament of Canada Website.   He used Google Earth and Google Charts and associated code as his tools and shares the how to here.

While I do not find Google Earth maps pretty, I do like the flight angles, I love watching how the scale shifts as the earth moves from globe, to Canada, Québec, Montreal and then to the riding.  I really enjoy seeing the information pop up on the landscape and the satelitte imagerie in the background.  Cédric also used some nice cartographic techniques by shading electoral district colours to the proportion of the vote for the winning party.  At a glance it looks like he selected a lighter colour if the vote was less than 50% and a more sure solid colour when the vote is more than 50%.  I also aesthetically appreciated having the ridings transparent allowing the viewer to see the air photo/satellite images of the city and connecting the political process with a physical or tangible reality in the background.  I was impressed that uncertainty was visually represented on the electoral terrain.  It is notoriously difficult on a map to reveal multiple voices, and choropleth maps in particular are tricky as the polygon of a uniform colour deceives the reader into seeing/thinking/imagining the bounded social and physical terrain/phenomenon as being uniform.

Cédric SAM

Cédric SAM Election Mashup

Cédric SAM

Cédric SAM Election Mashup

Cédric Sam Election Mashup

Cédric Sam Election Mashup

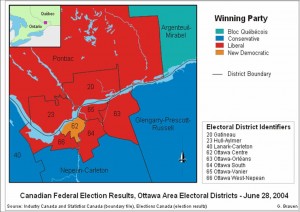
Glenn Brauen was able to use audio on his maps of the 39th election to feature uncertainty, complexity and multiplicity.  On his maps the proportion of the vote determined the audio levels of a speech read by the leader of each party. These audio files were then combined and attached to the electoral district.  As the users scrolls over the district multiple voices are heard, you may hear a clear and distinct leader’s voice and the others lower in the background, or in cases where the vote was very close you hear competing voices or cacophonie making ovious that red/blue/orange or light blue does not necessarily imply a clear win nor uniformity.  It was a really innovative way to show multiplicity.  He also used interesting open source technologies to create these: Scalable Vector Graphics (SVG) (W3 standard for web graphics), Java, and Adobe as well as NunaliitGlenn like Cédric shares his methodology, and graciously distributes his work on a CC license.
Glenn Brauen, Web mapping with sound using SVG

Glenn Brauen, Web mapping with sound using SVG

electopinion.ca

electopinion.ca:

Here’s what Twitter users think about their candidates
Voici ce que les utilisateurs de Twitter pensent de leurs candidats

electopinion

Carl Malamud in a Google TechTalk, “All the Government’s Information”:

[Thanks Eric!]

A couple of months back, datalibre.ca got hacked, Google delisted us, and our host shut us down.

I finally got around to doing a reinstall of wordpress, and replacing all the infected php file. Some twiddling left do do yet, but … we’re up and running.

Sorry for the glitch in service. But we’re back to our free data agitation now…

I am doing some research at the moment on the topic of Mapping the Risk of Homelessness in Canadian Cities.  To date I have not found many interesting or engaging maps in Canada albeit I did find some thematic static informative PDF maps.  I did however find some interesting maps in the US and one in Dublin.

Los Angeles Homelessness Hotspot Map

The purpose of the downtown Los Angeles Homeless Map is to visually tell the story of downtown’s homeless population. Before a problem can be solved it must be understood. These maps exist to convey the situation on the streets to City leaders, the Police Department and all those who are concerned with homelessness in our city.

There is an animated version of the Map.  Street count data were systematically collected by the LAPD on a bi-weekly basis.  The data were mapped by Cartifact. 

The system geocodes each address to produce coordinates for the address. The plotted points are then placed onto a map of downtown Los Angeles and styled to better convey the information.

San Francisco Chronicles Maps of Homeless Haunts

Layered over the city’s familiar streets and neighborhoods is a separate map seen from the vantage point of the homeless: Market Street is Main Street, the daytime hub; the Mission is a place to buy heroin; Golden Gate Park is the wild frontier – and the area around Pac Bell Park is a campground for people with pets.

This interactive Flash map is part of the San Francisco Chronicles Newspaper 5 part series on Homelessness entitled Shame of the City.

Dublin City Homeless Services Map

CentreCare map of self-referral services for homeless people over 18 in Dublin City.

Responses to October 2007 Draft Strategy

Arising from the 2006 National Summit, the Draft Canadian Digital Information Strategy (CDIS) was issued for review in 2007 from any interested person or organization. The review period is closed; however, the Draft Strategy remains available. All responses to the 2007 Draft Strategy are posted online.

Submissions received, including the name of the person or organization making the submission, have been posted in the official language in which they were submitted. Content of the submissions has been posted as received; however, minor reformatting may have occurred during HTML conversion. Personal address information has been removed.

Unfortunately, there were no folks from the free and open access movement (Except for Russel), there were no new media artists, there were no open source organizations, no media activists, there were no free data advocates, no podcasters, no organizations doing interesting work with media, no geomatics groups, no businesses, no volunteer organizations or civil sector organizations that submitted comments and feedback.

This lack of presensence is perhaps attributed to: short time to respond, exposure, who got sent the notice, the government speak of the document, the belief that it will not make a difference, cultural disconnect with the process and so on.

Too bad though!  As this document could have been greatly improved with inputs from those groups.  The consultation process was boring and lacked interactivity and so on, but alas it remains a consultation on an issue that may affect your/our works access into the future and your/our access to other works.

If someone has ideas on how to make participatory democracy sexier than this process then put it forward, otherwise this is what we wind up living with.

Very cool tourism and historical project – Passage to FreedomUnderground Railroad Locations and information.

Via: Spatial Sustain

Visualizing Information for Advocacy: An Introduction to Information Design written and designed by John Emerson, Principal at Apperceptive LLC. & Backspace and coordinated and produced by the Tactical Technology Collective.

Visualizing Advocacy

This beautiful pamphlet teaches basic Information design which is the use of

pictures, symbols, colors, and words to communicate ideas, illustrate information or express relationships visually.

The objective is to assist NGOs to communicate with information design so they can:

  • tell their story to a variety of constituencies;
  • use it as an advocacy tool, for outreach or for education.
  • facilitate strategic planning by making a visual map of a given situation.

There is access to data and there is making data accessible. This is the first grassroots data aesthetic communication tool I have ever come across, and it is wonderful.

I have a thing about cars, idling, air quality and really appreciate it when people develop interesting visualizations & sonifications that make car population issues tangible by using metaphors which make those data meaningful. While this is an HR intensive and expensive visualization project, it could not have been done without access to some free data and in this case Madrid Movilidad. I would have liked a bit more metadata and metholodological explanations to accompany the visualizations though! Nonetheless, this project reinforces the argument that experimentation and innovation comes with free data!

Cascade on Wheels is a visualization project that intends to express the quantity of cars we live with in big cities nowadays. The data set we worked on is the daily average of cars passing by streets, over a year. In this case, a section of the Madrid city center, during 2006. The averages are grouped down into four categories of car types. Light vehicles, taxis, trucks, and buses.

We made two different visualizations of the same data set. We intended not just to visualize the data in a readable way, but also to express its meaning, with the use of metaphors. In the Walls Map piece, car counts are represented by 3D vertical columns emerging from the streets map, like walls. The Traffic Mixer piece, where noise is the metaphor, is an hybrid of a visualization and a sound toy. The first piece focuses more on showing the data in a readable and functional way, while the latter focuses more on expressing the meaning of the data and immersing the user into these numbers. Both pieces try to complete each other.

Check out their videos!

Create Change Canada

is an educational initiative that examines new opportunities in scholarly communication, advocates changes that recognize the potential of the networked digital environment, and encourages active participation by scholars and researchers to guide the course of change.

Create Change was developed by the Association of Research Libraries (ARL) and SPARC (Scholarly Publishing and Academic Resources Coalition) and is supported by the Association of College and Research Libraries (ACRL). The website was adapted for the Canadian environment by SPARC and the Canadian Association of Research Libraries (CARL). The US version of Create Change is available here.

Create Change has a small section (relative to the others) on data. It refers to the 2005 National Consultation on Access to Scientific Research Data (NCASRD) report. But alas, there remains no national strategy or resources for infrastructures and policies on the issue of open access, dissemination and preservation of scientific data in Canada since that report. The NCASRD report was also only briefly mentioned in the October 2007 Canadian Digital Information Strategy (CDIS). I am glad Create Change mentions the NCASRD report as it is one of the few consultations that included data specialists and scientists, making its recommendations relevant, grounded in practice and includes clear recommendations and strategies overlooked by the CDIS.

The Harnessing Data Section also refers to the Research Data Centre Program which is a closed shop when it comes to citizens as it is a Statistics Canada initiative only open to researchers, a great US National Institute of Health (NIH) genetic sequence database GenBank® and a Canadian Astronomy Data Centre. Odd that the Science Commons and the work of government departments that disseminate scientific data such as NRCan’s Data Discovery Portal is not mentioned! Both of these were groundbreaking. Most notably the very progressive Geobase Unrestricted Use Licence Agreement, open and free access to some (not all) of Canada’s national framework data and GeoGratis which disseminates free data. Canadian’s still do not have access to basic national, provincial and municipal geomatics data sets (let alone a most socio demographic data), nonetheless, the work of GeoConnections is surely to grow and their dissemination, accord signing, technological approaches, standards and partnership practices can most certainly be emulated elsewhere.

I hope Create Change will help open up natural and social science data to Canadians. At the moment their site provides much more on open access journals, new forms to disseminate and discover scholarly works, methods to create those works, and the scholarly merit system. There is less on scientific data, perhaps as is normally the case in Canada, scientific organizations like CODATA, or science producing organizations are not at these tables. I fully support the direction Create Change is going, however, journals, scholarship and the merit system evolve around access to data – data is what informs scholarly works and I would love to see more input from the data people!

I was very excited to see which journals are accessible in their Expanding Access Section and I look forward to seeing scientific organizations contribute to their Harnessing Data Section.  They most certainly have the right cultural institutions, publishing, and library people at the table but they are missing scientific data associations and archivists.

« Older entries § Newer entries »