Uncategorized

You are currently browsing the archive for the Uncategorized category.

The Federation of Canadian Municipalities in its work on Quality of Life Reporting in Canada’s 24 big cities has just released its 6th thematic report:

Mending Canada´s Frayed Social Safety Net: The role of municipal governments

These reports are really loaded with Municipal, Provincial and Federal administrative data on a wide variety of topics.

Collecting data from cities is incredibly difficult, it gets worse at the provincial level, and improves somewhat at the Federal level with some departments being better than others.

I hope that Open Data movements and initiatives in Canada will inspire all of our public sectors. Our 3 at times 4 levels of government will hopefully begin to coordinate their information and data resources and make them more readily available to the public.

Canadian’s need more evidence based reporting than ever, to manage the smaller finacial morsels coming back to our cities, and it is reports like these that help us inform those decisions. Clearly, we have been missing some evidence!

Benedict Anderson’s wonderful book on nationalism Imagined Communities introduced the idea of simultaneity. Print media, back in the day, especially in vernacular languages (i.e. not latin) enabled the reading of the same ideas in different places at the same time (i.e. the morning paper) for the first time. This, he stated, created unity and a form of distributed collective identity, a disparate community bound by ideas, in some cases forming a nation.

Eduardo Galeano, in his book Soccer in Sun and Shadow did the same as Anderson, in his case it is not through print media but instead soccer that community, a shared identity and a nation are created:

“All Uruguayan babies are born crying, ‘goal’,” the Uruguayan writer and soccer aficionado Eduardo Galeano said over coffee recently. Perhaps, that’s how a country of three million or so could have won two World Cups and two Olympic gold medals. It also helps explain the country’s level of despair after Uruguay’s dramatic World Cup elimination at the feet of the Australian Socceroos last November in a penalty shootout.

(ref).

In Canada, some say it is Hockey. In my case, I would say, Olympic Hockey, as I do not pay attention to the sport at any other time, it is just not a part of my reality, it is not a marker of my identity. Yet, like millions of others, I demonstrated a sense of patriotism and participated in the national act of watching the Canada – US Gold Medal men’s Game.

And what does that have to do with data? Well, back to simultaneity – more so the measuring of it.

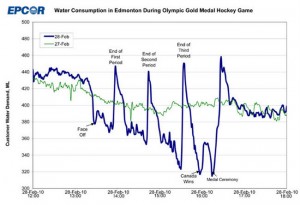
EPCOR, the water utility in Edmonton measured water consumption during the game, and as seen in the graph below.

Simultaneity

The EPCOR spokesman Tim le Riche, explains:

“The chart does tell us that Edmonton hockey fans are pretty dedicated,”

Water use plummeted below normal right at the 1:30 p.m. faceoff time.

Usage held around 370 megalitres (ML) until the first intermission, when use skyrocketed to 450 ML within minutes.

There was less water used during the second period and even less in the third.

Use dropped to 320 ML near the end of the game, when the U.S. scored a tying goal at about 3:30 p.m., and again when Sidney Crosby scored the winning goal in overtime.

Usage skyrocketed to 460 ML immediately after the medal ceremony.

It’s assumed most of the spike is due to bathroom use, said le Riche, though it would also include water used in the kitchen and in bars.

Data analysis at its best!

Via:
Flowing Data: Canada: the country that pees together stays together
Pat’s Papers: What If Everybody in Canada Flushed At Once?
Edmonton Sun: EPCOR charts fan flushes
Smart Planet: Infographic: Water consumption in Edmonton, Canada during Olympic gold medal hockey game

The City of Ottawa is discussing Open Data. On March 1. 2010 a Report to City of Ottawa: Information Technology Sub-Committee / Sous-comité de la technologie de l’information was discussed between and among City staff & councilors and three members of the public.

The discussion yielded quite a bit of press in all the Ottawa Daily’s and on CBC:

Tracey p. Lauriault was interviewed on CBC Radio’s drive home show All in A Day by Alan Neal today. The meaning of open data for every day people and for the municipal democratic process was discussed. An MP3 clip of the interview is available upon request, just leave a comment w/your email address.

Ottawa Citizen: Sub-committee examines benefits of open data policy, by Neco Cockburn, March 2, 2010.

Le Droit: La Ville d’Ottawa compte devenir plus transparente – La capitale veut mettre en place une politique d’accès libre à ses données, par Dominique La Haye, 2 mars 2010.

Ottawa Sun: City mulls ‘open data’ for mobile phone apps, By Jon Willing, City Hall Bureau, March 2, 2010.

Ottawa Citizen: Need city data? Nope. There’s no app for that…Advocates of open data say making city info readily available in a format programmers can use would help citizens navigate services and save the city money. By By Neco Cockburn, March 8, 2010.

Tags:

This is a big week!

Friday, March 5 all day, there is a fantastic conference at Ottawa University for the inauguration of the Centre for Law, Technology and Society: Taking Stock of Tech: Reflections on Law, Technology and Society. The conference Program is fantastic and includes some of the world’s foremost authorities on things law, infrastructure, data, socio-tehnology…

Thursday, March 4, Cambridge Room of the Holiday Inn, 111 Cooper Street in downtown Ottawa at 5:00 p.m., Lecture: Zeroing In: Infrastructure Ruins and Datalands in Afghanistan and Iraq by Dr. Lisa Parks, chair of film and media studies at the University of California at Santa Barbara (UCSB)

Parks will analyze satellite images of declassified pictures of bombed sites in Afghanistan and Iraq in the context of the American policy that limits access to satellite images due to U.S. national security interests, as well as discussing some of the controversy surrounding the use of Google Earth..

Today, March 1, The City of Ottawa IT-Sub Committee meeting discussed Open Data.
3 Constituents spoke: John Whelan from Open Street Map (OSM) Ottawa, Hacktivist Edward Ocampo-Gooding and Tracey P. Lauriault.
I characterize the sentiment as cautious optimism, with concerns regarding the private sector capitalizing on open data, cost recovery, and cost priorities of the city. The argument was made that business being innovative with data was good as they are our employers, our tax payers and our revenue generators.
There was great support from Councilor Legendre, Rideau-Rockliffe Ward, stating that the most dangerous argument being made was for ‘democracy’. He was also very surprised that the City did not already have such a an open data policy in place. The Chair of the Committee, Councillor Wilkinson Kanata Ward, was very interested in different applications, while Councillors Chiarelli, College ward and Desroches of Gloucester-South Nepean Ward, expressed concern for costs to implement and the loss of potential revenue generating activities. Bref – The ideas of open data, open access or open government were new to all the councillors and my take is much education is required to help our representatives understand the issues.
City Staff did a great job putting together a presentation showcasing other city initiatives, innovative applications, benefits to the city and the demand for this by citizens.

The Economist: Of governments and geeks

In several countries more official data are being issued in raw form so that anybody can use them. This forces bureaucrats and creative types to interact in new ways

Among America’s number-crunchers-in-chief, it is Mr Chopra whose office comes closest to the new culture of using data in a free, creative way. He thinks more government agencies should mimic the division of labour that now defines his own job at the top of the American administration: a CIO who guards stable information platforms and a CTO who cultivates data-handling talent in the open market.

Even the UK has come on board, recognizing that managing royalties and sales under the guise of cost recovery is more expensive than sharing the data.

Tom Steinberg, a British pioneer of data use, believes that what is valuable is what the market already pays for. He runs mySociety, a non-profit organisation founded in 2003 that builds simple web-based tools with self-descriptive names like “faxyourmp” and “fixmystreet”. Location is crucial to detecting patterns in public information; a map of crimes is more valuable than a list. Britain’s Ordnance Survey owns the country’s geographic data and, through an arrangement known as a “trading fund” sells them to, among others, mySociety. In 2008 economic analysis commissioned by Britain’s Treasury argued that the public value of the trading-fund information was greater than its revenue value to the crown; mapping data will be released free of charge from April.

The Economist: Of governments and geeks

Strange Maps has a wonderful series of posts that examine current political outcomes as viewed in electoral maps and explores the clustering patterns of those results with historical, territorial and demographic boundaries and patterns.

It would be great to see these historical patterns in Canada. Imagine a map of past electoral results animated to show change overtime and to compare those with a variety of religious, linguistic, age and a selection of other demographic variables to see if there is a pattern in Canada!

Also, on an electoral note, the UK is releasing its Postal Code geodata. In Canada, people have been lobbying to get access our postal code lookup file for free with unrestricted use because it can link postal code with electoral boundaries, a simple democratic process tool that is most certainly not libre in Canada!

See previous datalibre elections posts:
40th Canadian Federal Election Results 2008

Anti poverty advocates often have difficulty getting their points across. A new campaign in Hamilton called Do the Math has developed an interesting collaborative strategy to do just that! The Spec explains the process in this article Does $572 a month cover basic needs?. The following photo explains it all!

Does $572 a month cover basic needs?

Does $572 a month cover basic needs?

as in comprehensible is difficult. This morning I was looking at a few of my favourite blogs and in Flowing Data came across a great multimedia educational site that uses multimedia to impart the idea of scale and cells. Wonderfully simple.

Citizen science is a great way to gather data for research. In this case a tool called ISpot facilitated the indentification of a moth found by citizen scientist.

I read this article this morning in the UK Independent about a young girl who found a moth on her windowsill. Her dad subsequently took a picture of it and posted it on ISpot. It was a new discovery for the UK but not a new species which was identified within 24 hours by an Open University expert.

The Moth was later added to the Natural History Museum‘s collection. Seems like this young girl is quite a nature enthusiast who was inspired to start visiting the museum.

Martin Harvey, a researcher at the Open University’s Biodiversity Observatory, who identified the moth, said: “Katie’s find demonstrates the power of the internet, and iSpot in particular, in helping everyone learn about wildlife.

Wonderful!

Public sector information (PSI) aka government data access and sharing is culturally different than the sharing of data between and among scientists. And within science there are many different subgroups that have different takes on data sharing. This is also true when it comes to data preservation and archiving, and the consideration that all of these datasets are cultural heritage and national assets. One could argue that science data are also PSI or government data since most science is paid for with public research dollars. There is of course foundation money as well, and these too have a different data sharing culture.

The Online September issue of Nature is dedicated to the topic of data sharing in the sciences. Note, that does not necessarily include geomatics data, and yes folks, again a different data sharing culture.

Bref – different information ecologies and attention structures dictate how members of data creator communities do things.

« Older entries § Newer entries »