Articles by Tracey

I like data and think it should be shared at not cost! Especially public data!

I am happy to announce that the Canadian Council on Social Development‘s Community Data Program will be representing Canadian civil society at the Open Government Partnership meetings in Brazil.  The letter that was submitted is available here.

Harvey Low will be the Rep and he is looking for your insight!  If you have not done so already please register to the civicaccess.ca list or drop a comment here if you want to participate in a conference call.  We need your ideas.

All input will be posted here, and important and useful links will be posted here.

We look forward to hearing from you!

This is a bit more data than I would like liberated.

Also for some fun you may want to tell Vick everything cuz he really wants to know! #TellVicEverything @ToewsVic #Toews and I thought this one was pretty good:
Dear Mr. @ToewsVic Because we love you, I am asking every Canadian to fax you their grocery list at 613-995-1049 #TellVicEverything #Toews

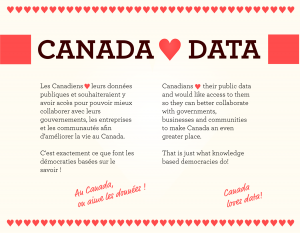
Happy V Day

This card was created for last year!  But I am proud to share it again, because, well, ffunction‘s work is timeless.


Canadians working with statistical and research data include government documents librarians whom we find in most university research libraries.  Many government document librarians and their colleagues, the data librarians, participate in the Data Liberation Initiative (DLI) which I introduced in a post honouring one of its founders.  They are also often members of the Canadian Association of Public Data Users (CAPDU) among many other important data related organizations.  The DLI also does much capacity building for research, data and map librarians in yearly face to face meetings and online discussion, developing expertise which is then shared among colleagues in their home institutions.

Aspi Balsara is one of the government documents librarians at the Queen Elizabeth II Library, Memorial University of Newfoundland.  He is a CAPDU member and has been kind enough to share his latest FAQ about various initiatives to disseminate Statistics Canada data.  The post is technical and specific in nature, but demonstrates quite nicely the kind of expertise we have across Canada in this area, a knowledge base that is often overlooked.  The FAQ introduces many databases and formats while also answering new dissemination policy questions.

Finally, this post also introduces a data community of practice with experts who collaborate nationally to benefit their local users using LISTSERVs technology, which ain’t fancy, but sure is effective in a place like Canada with its smart people scattered all over a big geographical expanse.  Twitter does some things well, but these lists and their archives are invaluable in fostering near real time deep collaboration.  People get to meet face to face once a year thanks to the DLI, so the relationships are quite strong.

***********************

FAQ on various dissemination initiatives from Statistics Canada

1.     Are all Public Use Microdata Files (PUMFs) available to the public, or only some of them?  All PUMFs are available, free of charge.  This has been the case for the past year and a  half.

2.     How does the public access and order a PUMF?   The public may order it directly from the Statistics Canada homepage, using the Search the site feature.  After filling out the order form, the customer will then be contacted by Statistics Canada to sign a licence agreement.  Upon receipt, the data is put on CD-ROM and shipped.

3.     Do these freely available PUMFs include SPSS and SAS command files (as they do for DLI subscribers)?  The codes are generally available in SAS which is what Statistics Canada (SC) uses.  SPSS is used mainly by the academic sector. SPSS may be available sometimes, but when derived from SAS, its quality is questionable as it does not include “missing values”.  Eventually, through the Common Tool for Social Surveys, SC will have more standardized output, including good SPSS codes.

4.     Since PUMFs are now publicly accessible, what value do DLI subscribers get for their subscription?  Revenue from DLI subscriptions pays for the infrastructure, regional and national training for the DLI contacts, prompt support through the listserv, and other initiatives.   No money goes toward paying for the data. This has been emphasized at the DLI training “bootcamps” where DLI contacts are asked to convey to their library administration the value of the training and support available from the DLI.  This is also pointed out in the DLI annual reports.

DLI subscribing institutions can share a PUMF in a classroom or lab environment.  Otherwise, a professor would have to obtain a licence from Statistics Canada that each student would be required to sign before using the PUMF.

Through the DLI, member institutions also have access to the Discharge Abstract Database (DAD) Research Analytic Files from the Canadian Institute for Health Information (CIHI).  The Discharge Abstract Database is only available to DLI members (see no. 11 below).

5.     In November 2010, Statistics Canada announced its intention to launch a subscription service to all its PUMFs.   This service was targeted to non-Canadian subscribers for an annual fee of $5000.00.   Is there any information about it?  This service aims at national and international organizations outside the DLI who wish to access SC’s complete PUMF collection, be informed of new releases, and avail of a service that answers their queries.  This service is called the “Public Use Microdata File (PUMF) Collection”.

See: http://www.statcan.gc.ca/bsolc/olc-cel/olc-cel?catno=11-625-XWE&1ang=eng

6.     With free CANSIM access beginning February 1, 2012, will the CANSIM component in E-Stat continue to be provided?   If so, will it be updated more than just once a year? In April 2012, Statistics Canada announced that E-Stat would be archived on June 30,    2012. It was last updated July 2011 and will remain so until removed permanently on June 30, 2013. (In the meantime, E-Stat can be accessed by clicking Students and teachers in the left menu bar of Statistics Canada’s homepage.)  Hence, there is no point using the E-Stat version of CANSIM anymore.

Other resources on E-Stat, such as the 1996, 2001 and 2006 censuses can be accessed from: http://www12.statcan.gc.ca/census-recensement/index-eng.cfm as well as from the library webpages at:  http://guides.library.mun.ca/canadianstatistics  and http://guides.library.mun.ca/content.php?pid=207197&sid=1734802

A new web location has yet to be determined for Census years 1665-1871, 1986 and 1991, as well as environment and elections data (currently accessible via E-Stat).

7.     Is it just the CANSIM data that will be freely available as of February 1, 2012, or all of Statistics Canada’s data? In addition to CANSIM, select census data products for 2011 will be freely available.  Statistics Canada will maintain current pricing practices for print publications, maps, CD-ROMs and custom products and services.

See: http://www42.statcan.gc.ca/smr09/smr09_035-eng.htm

8.     Are the geography products also freely available? As of November 29, 2011, geography data from the 2006 and 2011 censuses are available free of charge except for postal code products since they are provided by Canada Post. As it stands, DLI member institutions have access to postal code information products that can only be used for research and teaching purposes and cannot be shared with non-DLI institutions.  While these products are freely available to DLI subscribers, it should be noted that Statistics Canada is presently negotiating with Canada Post for continued access to postal code products.  If and when an agreement is concluded, it will be added as an appendix to the DLI licence agreement.

 9.     Does the public have to pay for DA (Dissemination Area), Block level data (basic population and dwelling counts) and FSA (Forward Sortation Area) data?   Data for DAs – for 2011 and previous census years – are now available for free upon request.  This is why you will see a “contact us” link for census tables at the DA level (whereas previously there was a $ sign since these tables were not freely available).  Block level data is available at the population and dwelling count level from GeoSearch or GeoSuite, and there is no charge.  FSAs come under postal code data covered above in no. 8.

10.  The new DLI licence (sent to subscribing institutions in September 2012) no longer states explicitly that data are restricted to research and educational purposes only.  Does this mean that commercial use of the data is now permitted?   Firstly, the majority of Statistics Canada’s standard and custom products will be disseminated under the terms and conditions of the Statistics Canada Open Licence Agreement.   See:  http://www.statcan.gc.ca/reference/licence-eng.html   It permits a worldwide, royalty-free, non-exclusive licence to use, reproduce, publish, freely distribute, or sell the information. This means that standard data products once distributed by the DLI, such as Intercorporate Ownership, SABAL – Small Area Business and Labour Database can now be made accessible to the general public and not just the       university community. However, lifting the restriction on such data is left to the discretion of the DLI member institution since it is then obliged to shoulder responsibility for providing support to outside clients. Organizations that prefer to maintain the restriction may refer non-university users to Statistics Canada for assistance.

Postal products are still restricted to DLI members (as explained in no. 8 above).

Public Use Microdata Files (PUMFs) are covered in an appendix to the new DLI Licence Agreement. Basically, bona fide members of a DLI member institution may use a PUMF for commercial purposes but cannot provide the file to outside clients.  For instance, a professor may publish the findings from a PUMF in a text book, but may not reproduce the data or share it.  Similarly, she may submit research for a client that draws upon a PUMF but cannot include the data. Should the client wish to consult the PUMF, she would follow the procedure described in no. 2 above.

11.  When will CIHI (Canadian Institute for Health Information) add its files to the DLI?

Plans are under way to make the Discharge Abstract Database (DAD) available as a DLI file (see no. 4).  The DAD focuses on inpatient acute care discharge in Canada (excluding Quebec).   The files will be available to the DLI community through the DLI FTP site once all members have signed and returned the licence agreement distributed last September.

Aspi Balsara

Feb 14, 2012

Revised:  April 17, 2012;  May 4, 2012, October 15, 2012
Today, Statistics Canada released the head count and the dwelling count of the 2011 census, the 2011 Census, the shortest decennial census in the history of Canada, the 1st official census since confederation was taken in 1871. More data on age, relationships and language to follow, and uh that is it!
The Census is the only legislated instrument that counts everyone every 5 years. Surveys come and go, are not legislated and do not have designated budgets.

Also, Statistics Canada announced a short while ago that its data were going to be disseminated for free for the first time and under a new more open and less restrictive licence (G&M article, Embassy Magazine Article). This is really good news as cost recovery was a horrid policy instrument barring access to data that we by law had to give away. Restricted access only allowed for a small subset of the population to study, discuss and know about who Canadians are. It also meant that we were not getting collectively smarter.

I and many others were and remain concerned that we do not know what data exactly will be made available, at what level of geography, will cross tabulations and special orders such as by neighbourhood or ward be more expensive than before, will that licence be as open, and as Woolley observed, how the data are disseminated is of concern, since well, right now it is clunky at best.   We all do applaud the effort.

Upon playing with the data dissemination interface today, my concerns were re-affirmed.  The data are free but not necessarily accessible, in the sense that the methods used to disseminate and discover these is complicated, unclear and there are some favourite geographies missing – most notably Dissemination Areas (DA) while others are hidden – Census Tracts (CTs).

For example, if you go to the Census Profile and you want to look up 5 cities at once you cannot! You can only look up one city at a time, which also means you can only download one geography at a time.  There are over 2000 cities in Canada and if you want to know who the top 30 are in terms of population, then its “Houston we have a problem!” sorta.

Furthermore, once you look at your city, you are provided with Census Metropolitan Areas (CMAs), Census divisions (CDs) and Census Subdivisions (CSDs), economic region (ERs), electoral districts (FEDs) and population centres (POPCTR).  CTs are hard to find and DA data more so.  CTs and DAs are smaller geographies very helpful for sub city analysis.  Now, when you do get lets say FED data for your city, you only get provided with one district at a time and not the cities FEDs at once.   So,  have to go back and download them one at a time and then assemble the file.  CT and DA geographies are also not in this list.  You have to dig for those!

To get to CTs  (no DAs to be found yet)  my friend Sara a GIS expert at the Social Planning and Research Council of Hamilton made this discovery:

  1. Go here
  2. Click on Thematic Maps (scroll down),
  3. Go to CMA maps & choose your location.
  4. Then on the following page there will be a link to the map and a table with all the pop change values for each CT.

Alternatively, and again thanks to Sara you can do the following:

  1. Go here
  2. Then type in a random CT (you can use the example given at the bottom of the list).
  3. On the next page, click the CT number
  4. On the next page, click the download tab.
  5. Then scroll to Option 2, and select Census tracts and your data format,
  6. and “Continue” – Voila, it will download a file for population counts for all CTs in Canada!

Which is ah, absurd. First cuz, well that is a lot of clicking to get to what should be on the first page.  Second, what CTs are in my city?  This file organizes CTs into CMAs which are not CDs or CSDs.  CDs or CSDs correspond to the legal administrative boundaries of cities and municipalities.  CMAs are much larger geographies, they are a StatCan construct and are not an official administrative city or municipality.  You have to be an analyst or a good dictionary reader to know this.  Most people report CMA results, but those miss many cities and some cities are split.

Also, what if you want 5 cities at a time and not just one at a time?

Ted, the GIS expert at Community Development Halton, who was trying to join the CT data with his geomatics files discovered the following:

Unfortunately, the CT table is a mess for GIS purposes.  For each CT, there are 7 entries (rows) for each discrete piece of information (Population in 2006, 2006 to 2011 population change (%), Total private dwellings, Private dwellings occupied by usual residents, Population density per square kilometre, Land area (square km)). When trying to perform a join, ArcGIS doesn’t know which of the rows to join on to map it.

You can however, download complete files in not well coded spreadsheets at a variety of geographies for all of Canada here  by selecting Option 2 – Comprehensive download file for a selected geographic level.  This is great, but be sure you know what you are doing with these data as there is a lot going on! For example, if you download the CT file they are organized by CMA, you do not have a way to know which are in your CD or CSD and that would be a nice addition. It would be even better if a table provided CTs, and city, or electoral districts and the CTs they contain and CSD with their postal codes, CTs or CSDs and their DAs and so on.

But where are those pesky DAs?,

Analyst will do fine with this release, after incessant digging, the GIS folks will have to play around with things and they will grumble at the waste of time incurred with coding and joining.  Journalists and the public will however find it hard to compare cities.  People default mistakenly to CMAs, but CMAs a city they are not.

Sara also pointed me to these gems

These reference maps are also excellent as these help unravel georeferences  and you can download geographic files here.   The search by postal code is a nice feature, as finally you can enter your postal code and find out which census geographies you fall into.  DAs are not there either!  People however really want that postal code file for free! It is the file that can be used to look up your elected officials and many democratic engagement tools have been developed, and they are sorta illegally page scraping that data all to foster democratic engagement, that file should be shared as broadly as possible.  If the government is going to open data then one would presume Crown Corporations and Agencies are also part of that deal!

But what if you want all the postal codes for your city, or all the CTs and DAs for you city and what if you want that for more than one city at a time, then you are out of luck as the tool does not allow for that type of access.

Anyway, there will no doubt be more discoveries and grumblings and I hope StatCan will work with users to make these things more useable.

Finally, a community of practice is really important, the Social Planning Network of Ontario (SPNO) data list folks were busy this morning communicating among analysts as they were looking for and finding things. These folks know their stuff well and have their members in their communities to answer to, who will no doubt be looking for NEW DATA arranged in a way that is meaningful.  Social Planning and Community Development councils have been working with these data for a very long time and have much of expertise. Demographic and geographic data are complicated and you need to know how to work with them, you need to be sensitive to underlying issues when communicating these and these folks do so with care.

Perhaps, as David E. pointed out, StatCan will begin training people more broadly on how to use these data! Alternatively, people may find a way to resource planning councils to enable them to train journalists and others on how to work with these data on StatCan’s behalf.

oh yeah!  DAs!  After emailing StatCan, I was directed to Geosuite for the 2011 Census.  But I could not find them in there either!  It is a nice tool that has to be downloaded, and as one Research Librarian Veteran commented, it will be nice when StatCan data products are software agnostic and operation system neutral, GeoSuite does not work on a MAC!

DA DATA FOUND – in GeoSuite you have to choose the Chart Search from the main Menu.  The data in there are not for the faint of heart though! (Thanks Amber from DLI List).

Below is the letter that was submitted today requesting that the Community Data Program be a civil society representative for Canada at the Open Government Partnership meetings in Brazil 2012.

The date of submission is Monday the 6th of February. If you have comments or would like to endorse this letters please email me at tlauriau@gmail.com, Thanks!

The CDP just received a new endorsement from Open North Inc.

Matthew is a graduate student at the University of Alberta, an Open Data advocate and an aspiring neogeographer. He can be reached via email at mdance@ualberta.ca or @mattdance.  I met at the Cybera Data for All Summit in Banff last year.

*********************************

The GeoWeb, Citizen Science and Open Data

We are at a confluence. The two related but separate domains of the GeoWeb and Citizen Science are on a collision course with the open data and open government movement.  Lets start with some definitions:

  • The GeoWeb, (from Wikipedia) derived as a mash-up from geographic + World Wide Web, creates greater utility of the abstract information made available on the Internet by providing a geographic or location context.  For instance, emitter.ca created greater utility of Environment Canada’s National Pollution Release Inventory by (1) making those data available as a CSV (rather that MS Access) in an open data catalogue (datadotgc.ca), and by (2) mashing the data with a Bing! Map such that the data are searchable by location – by street address or city.
  • Citizen Science can be defined as scientific activities in which non-professional scientists volunteer to participate in data collection, analysis and dissemination of a scientific project (from Muki Haklay’s blog). While there are new undertones to this definition, citizen science is an old practice in Canada for the collection of climate and animal data.

To understand this collision course, it is worthwhile to understand the roles that citizens have played in GIS as a precursor to the GeoWeb, as well as with the GeoWeb itself.   

The domain of Public Participation GIS (PPGIS) emerged in the 1990s with the widespread adoption of desktop computer systems that lowered barriers through reduced costs and training requirements (Longley, 2011); reduced barriers opened GIS up to more varied practitioners (Sieber, 2006). PPGIS defines a practice where GIS technology and methods are used in support of public participation and decision making in a number of domain applications (Sieber, 2000) ranging from urban planning to public policy development. The explicit desire of PPGIS is the empowerment of less privileged groups (relative to the authority implementing the PPGIS) by including them in an authority led decision processes by improving transparency and access to the input stages of a policy, or similar processes (Schroeder, 1996).

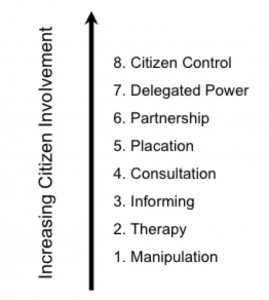
This desire for the empowerment of less privileged groups, coupled with 1990’s desk-top computer technology, defines the PPGIS process as a top down process where a central authority (i.e. government, researcher) identifies a problem, the best way to address the problem, and who can be granted access to the process to achieve the desired outcomes (Carver et. al. 2001).  As such, PPGIS is a multi-dimensional entity whose core components include notions of ‘public’ and ‘participation’, but are poorly defined in the literature. In fact, it is a 1960’s model of Citizen Involvement.  The following is Arnstein’s (1969) Ladder of Citizen Control most often used in the PPGIS literature.

Arnstein’s Ladder of Citizen Control

It is the notion of Social Computing that sets the GeoWeb and Citizen Science on a collision course.  Social Computing exists in contrast to the closed networks of the PC era, and can be defined as the ability of users to create, interact with and manage an information space that is dynamic, socially collaborative, portable and location sensitive (Parameswaran and Whinston, 2007). Social Computing is the technology that allows us to connect everything to everything (Hudson-Smith, et. al., 2009) in a network whose value increases as its membership increases (Benkler, 2002). As more members and devises connected to the network, the larger the information circle any one individual has.  This, coupled with enhanced communication predicated on mobile devises that can record and transmit spatially and socially relevant data, potentially challenges established power structures and traditional modes of citizen engagement with an authority driven process, such as PPGIS.

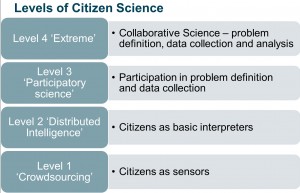
Social Computing facilitates a collision between the GeoWeb and Citizen Science by enabling citizens to participate more fully in the scientific process.  Muki Haklay, proposed the levels of Citizen Science found in the Figure below. In this model Level One defines the citizen as a purveyor of volunteered geographic information (VGI) where the citizen provide observations or sensor data to a scientific process.

Levels of Citizen Science from Muki Haklay, 2011

Level Two sees a citizen or a group of citizens act as interpreters of the data; in Level Three a citizen participates with a scientist in the problem definition and defining the data collection plan, and finally; Level Four sees the citizen working in collaboration with the scientist, even parallel to the scientist, where the citizen decides on the problems and methods to achieve a desired outcome.

Integral to this process is the fate of the data that citizen scientists provide to a process.  My next post in this series will develop these ideas further and provide some examples of Citizen Science in action, including an air quality monitoring pilot project in development in Edmonton.

References:

Arnstein, S. R.,  A ladder of citizen participation. Journal of the American Institute of Planners, 35(4):216– 224, 1969.

Benkler Y. Coase’s penguin, or, linux and the nature of the firm. 2002.

Carver, S., Evans, A., Kingston R., and Turton, I.. Public participation, gis, and cyberdemocracy: evaluating on-line spatial decision support systems. Environ. Plann. B, 28(6):907–921, Jan 2001.

Hudson-Smith, A., Crooks A., Gibin M., Milton R., and Batty M. Neogeography and web 2.0: concepts, tools and applications. Journal of Location Based Services, 3(2):118–145, Jun 2009.

Longley, P. Geographic Information Systems and Science. Wiley, 3rd edition, 2011.

Parameswaran, M. and Whinston, A. B. Social computing: An overview. Communications of the Asso- ciation for Information Systems, pages 762–780, 2007.

Schroeder, P. Criteria for the design of a gis/2., 1996. 

Sieber, R. GIS implementation in grassroots organizations. Urban and Information Systems Association Journal, 12(1):15–29, 2000.

Sieber, R. Public participation geographic information systems: A literature review and framework. Annals of the American Association of Geographers, 96(3):491–507, 2006.

It is very troubling when the nation’s top data producing agency squashes debate and pretends that the data it is producing is ‘methodologically sound and scientifically valid’ and communications departments call the shots while scientists, methodologists and subject matter specialists are silenced.  The governments is promoting transparency on one side (e.g. open.gc.ca), Canada has signed onto the Open Government Partnership, and government websites have proactive disclosure links, all the while transparency is not culturaly normalized in government institutions and management structures.

This is where ‘real’ transparency needs to occur, otherwise what is the point of a democracy when telling the truth is a carreer limiting move.  I do not want to live in a culture of yes people, divergent views is where we learn, test and re-evaluate.

Thanks to the resignation of the chief economic analyst at StatCan, at least we now know why non custom and non small geography national household survey data will be free – it ain’t good data! Sor much for open data!

Open data includes access to good data, and transparency means more than the disclosure section on a government website.  It is also interesting
that the 10 principles of open data all us open data enthusiasts quote do not include a principle on ‘quality, reliable, accurate and authentic data’.  I think it is time for a new principle and for some government principles.

We know that Philip Cross adheres to and understands both and it is a shame that good and smart people have to resign for us to hear what is really going on.  I want a government full of smart people doing the right thing according to their mandates and the ethical standards of their professions and disciplines.  To me that is just plain part of good governance.  Othewise, how can we trust what the government produces.  Honestly, I do not want to distrust the Canadian government, I live in Ottawa and I know lots of good people with integrity who are the best we can ask for in a public servant, unfortunately for them, the climate they are working in is testing their resolve, and people are keeping their heads low.

My faith in government keeps being tested these days and I fear that this new culture of yes people will be the new norm, which may perpetuate mediocrity and ill informed decision-making, which is unfortunate for us all as we have a great country, and it would be great if it could be governed by great people who can take us to greater and better heights, instead of great people who cannot tell the truth and by not doing so mislead us all.

Globe and Mail Article: Statscan’s chief economic analyst quits

Why Canadians Should Participate in the SOPA/PIPA Protest and what you can do.  (via Michael Geist)

« Older entries § Newer entries »