Articles by Tracey

I like data and think it should be shared at not cost! Especially public data!

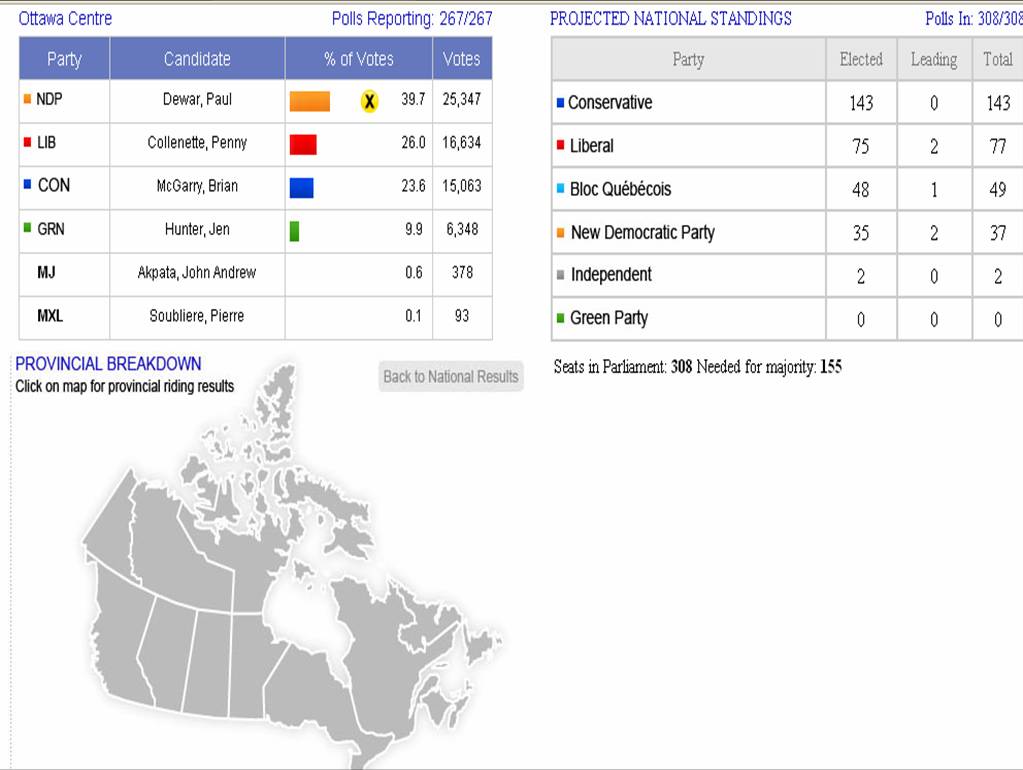
I was looking for maps all night on the Tele!  None appeared so I came home and found a few.   I wonder if the cost and license restrictions of the actual electoral boundary file was an issue for television networks and the media.  The only institution that provided a map with ridings was CBC. The rest were visualizations or shell maps of provinces and territories.

The CBC maps were interactive, with roll overs pop ups and some zooming capabilities!  As I predicted before seeing the maps, multicoloured areas are urban, west is blue with some patches of orange, centre is orange, east is baby blue, with some patches of red and blue, and all those country ridings are tory blue!  And Ottawa, which I did not predict, is surrounded by blue, with one orange and 2 reds!  Ontario, well, it is awfully blue!  Kinda fun to look around to see what is up!

CyberPresse has a pretty interesting visualization!  One cannot see the real geographic distribution of the results but it remains a creative and interactive way to see the votes!  As you scroll over the little squares a pop up window shows the results!  At a glance a user can see the number of seats per province and then look at the littles squares and their colours, this was perhaps a little less effective but I guess they were struggling with screen real estate and access to a base map.

CTV had a pretty rudimentary map of the provinces and territories.  If you click on the province you get a window of the ridings and a rather garish obtrusive list of ridings that blocks the map.  You select the riding and then you get the results of the province in a table but not a geographic distribution of results by riding.  The map is then left at the bottom of the page all lonely with not much information associated with it.
The Globe and Mail also had an interactive map but again just a shell with the provinces and territories like CTV example above, with a small bit of scroll over action that yields a pop up window and the left pane changing on the right.  Informative but not the big picture of the country like a map with all the ridings.

Finally there is our national institution, Elections Canada!  A few minutes ago it had no results! Oh My!  No maps, and not the most intersting way to access the info. I wonder if they will ever produce a map?  Will it be more than a static PDF? Since they own the base file you’d think they could do a little something with that monopoly access?  Or perhaps because Statistics Canada sells that for them they also have some sort of dissemination restrictions.

I just came across Many-Eyes which is a really great online collaborative data visualization tool designed by the IBM Collaborative User Experience (CUE) Visualization Collaboration Lab.

You essentially contribute a dataset and use their online visualization tools to see what you’ve got. A colleague added these Canadian City datasets and it was truly very easy and helpfull to find different ways to tease out patterns and to assess the best way derive a story from them.  The results provided us with a boundary object to facilitate our discussions on how we will design a report.

The options are great as you can create contemporary tag clouds, treemaps, network maps, flow lines, bubble charts, block histograms as well as your usual line graphs, pie charts and bar graphs.  They even have some rudimentory choropleth mapping tools.  You can view multiple variables and time series for a particular dataset which allows you to see change.

In our case, we will probably play with these tools and also excell graphs, present these to our graphic designers who will trace them into the look and feel of our report.  The best part is to know that we can communicate effectively without robbing the visualization bank and by moving forward on more interesting ways to tell our stories.

Enjoy!

Approved by Executive Council ~ May 21, 2008

Whereas connecting users with the information they need is one of the library’s most essential functions, and access to information is one of librarianship’s most cherished values, therefore CLA recommends that Canadian libraries of all types strongly support and encourage open access.

CLA encourages Canadian libraries of all types to:

Via CultureLibre.ca!

I am doing some research at the moment on the topic of Mapping the Risk of Homelessness in Canadian Cities.  To date I have not found many interesting or engaging maps in Canada albeit I did find some thematic static informative PDF maps.  I did however find some interesting maps in the US and one in Dublin.

Los Angeles Homelessness Hotspot Map

The purpose of the downtown Los Angeles Homeless Map is to visually tell the story of downtown’s homeless population. Before a problem can be solved it must be understood. These maps exist to convey the situation on the streets to City leaders, the Police Department and all those who are concerned with homelessness in our city.

There is an animated version of the Map.  Street count data were systematically collected by the LAPD on a bi-weekly basis.  The data were mapped by Cartifact. 

The system geocodes each address to produce coordinates for the address. The plotted points are then placed onto a map of downtown Los Angeles and styled to better convey the information.

San Francisco Chronicles Maps of Homeless Haunts

Layered over the city’s familiar streets and neighborhoods is a separate map seen from the vantage point of the homeless: Market Street is Main Street, the daytime hub; the Mission is a place to buy heroin; Golden Gate Park is the wild frontier – and the area around Pac Bell Park is a campground for people with pets.

This interactive Flash map is part of the San Francisco Chronicles Newspaper 5 part series on Homelessness entitled Shame of the City.

Dublin City Homeless Services Map

CentreCare map of self-referral services for homeless people over 18 in Dublin City.

I was looking for some cross city comparison data yesterday and recalled the Federation of Canadian Municipalities (FCM) Quality of Life Reporting System (QoLRS).

Conçu par la FCM, le Système de rapports sur la qualité de vie mesure, surveille et fait état de la qualité de vie dans les villes canadiennes en utilisant les données provenant de diverses sources nationales et municipales. / Developed by FCM, the Quality of Life Reporting System (QOLRS) measures, monitors and reports on the quality of life in Canadian urban municipalities using data from a variety of national and municipal sources.

Regroupant initialement 16 municipalités à ses débuts en 1999, le SRQDV compte maintenant 22 municipalités, dont certains des plus grands centres urbains du Canada et beaucoup de municipalités de banlieue qui les entourent. / Starting with 16 municipalities in 1999, the QOLRS has grown to include 22 municipalities, comprising some of Canada’s largest urban centres and many of the suburban municipalities surrounding them.

The FCM’s QoLRS site includes all the documentation, data, metadata and methodologies related to the development of their indicators and the system they have developed.

:: Reports
:: Annexes
:: Indicators

Their data are most impressive.  You can download a spreadsheet of the data for each indicator for 1991, 1996, 2001 and I expect 2006 QoLRS will be coming soon.   Each variable was also adjusted to the current geographies of amalgamated cities which makes cross comparison across time and space possible (see the guide to geographies).  This was not easy to do at the time. Each spreadsheet includes the data source, the variable, and a tab that provides the metadata.  Which means that you can verify what was done, reuse those data or if you had some money & loads of time you could purchase & acquire the data pertaining to your city and add to the indicator system.  Unfortunately the FCM had to purchase these datasets and it cost them many many thousands of dollars.

There are 11 themes and 72 indicators over 3 census periods for 20 cities (Sudbury, Regina, Winnipeg, Niagara, CMQ, Saskatoon, Edmonton, Hamilton, Halifax, Windsor, Toronto, Kingston, London, Ottawa, Vancouver, Waterloo, Halton, Calgary, Peel, York).  Datasets come from:

  • Statistics Canada
  • Canada Housing and Mortgage Corporation
  • Environment Canada
  • the 22 cities themselves
  • Elections Canada
  • Audit Bureau of Circulation
  • Tax Filer Data
  • Human Resources and Development Services Canada,
  • FCM Special Surveys
  • Industry Canada
  • Anielsky Management (Ecological Footprint)
  • Canadian Centre for Justice

Putting something like this together is no small feat, so please go check out what is available, play with the data a little, and if you cannot find data for your city, call up your local councilor and ask them to become a member of the QoLRS team!  Also let the FCM know they are doing a good job, as this is one way for us Canadians to see what is going on in our cities overtime.

I was reading some of the web accessible INDU submissions by Canadian groups and individuals posted on Michael Geist’s Blog, and a common theme is open & free access to data and scientific research! Very Niiiiice!

You can access them and M. Geist’s here: Industry Committee on Canada’s Science and Technology Strategy

Science 2.0 — Is Open Access Science the Future?
Is posting raw results online, for all to see, a great tool or a great risk?
By M. Mitchell Waldrop, Scientific American

The first generation of World Wide Web capabilities rapidly transformed retailing and information search. More recent attributes such as blogging, tagging and social networking, dubbed Web 2.0, have just as quickly expanded people’s ability not just to consume online information but to publish it, edit it and collaborate about it—forcing such old-line institutions as journalism, marketing and even politicking to adopt whole new ways of thinking and operating.

Science could be next. A small but growing number of researchers (and not just the younger ones) have begun to carry out their work via the wide-open tools of Web 2.0. And although their efforts are still too scattered to be called a movement—yet—their experiences to date suggest that this kind of Web-based “Science 2.0” is not only more collegial than traditional science but considerably more productive…

read the rest of the article…

Via Zzzoot

I submitted a brief to the Study on Canadian Science and Technology of the House of Commons Standing Committee on Industry, Science and Technology.

I include items on data access, preservation, dissemination, the lack of a data and information infrastructure or vision, the lack of a Science Foundation for Canada and a small mention of community wireless networks.  I also briefly discuss the importance of public participation on these issues.

Responses to October 2007 Draft Strategy

Arising from the 2006 National Summit, the Draft Canadian Digital Information Strategy (CDIS) was issued for review in 2007 from any interested person or organization. The review period is closed; however, the Draft Strategy remains available. All responses to the 2007 Draft Strategy are posted online.

Submissions received, including the name of the person or organization making the submission, have been posted in the official language in which they were submitted. Content of the submissions has been posted as received; however, minor reformatting may have occurred during HTML conversion. Personal address information has been removed.

Unfortunately, there were no folks from the free and open access movement (Except for Russel), there were no new media artists, there were no open source organizations, no media activists, there were no free data advocates, no podcasters, no organizations doing interesting work with media, no geomatics groups, no businesses, no volunteer organizations or civil sector organizations that submitted comments and feedback.

This lack of presensence is perhaps attributed to: short time to respond, exposure, who got sent the notice, the government speak of the document, the belief that it will not make a difference, cultural disconnect with the process and so on.

Too bad though!  As this document could have been greatly improved with inputs from those groups.  The consultation process was boring and lacked interactivity and so on, but alas it remains a consultation on an issue that may affect your/our works access into the future and your/our access to other works.

If someone has ideas on how to make participatory democracy sexier than this process then put it forward, otherwise this is what we wind up living with.

The Socio-Economic Impact of the Spatial Data Infrastructure of Catalonia

Pilar Garcia Almirall, Montse Moix Bergadà, Pau Queraltó Ros
Universitat Politècnica de Catalunya
Centre of Land Policy and Valuations

M. Craglia (Editor)
European Commission
Joint Research Centre
Institute for Environment and Sustainability

This study gathered information and data from:

a sample of 20 local authorities participating in the Catalan SDI (IDEC) together with 3 control local authorities not participating in the SDI, and 15 end-user organisations, of which 12 are private companies operating in the Geographic Information (GI) sector, and 3 are large institutional users of GI. The findings of the interviews were presented in two separate workshops to the participating local authorities and end-user organisations, to validate the findings and discuss the outcomes.

Here are some of the findings:

  • main benefits of the IDEC accrue at the level of local public administration through internal efficiency benefits (time saved in internal queries by technical staff, time saved in attending queries by the public, time saved in internal processes) and effectiveness benefits (time saved by the public and by companies in dealing with public administration).
  • Extrapolating the detailed findings from 20 local authorities to the 100 that participate in the IDEC, the study estimated that the internal efficiency benefits account for over 500 hours per month. Using an hourly rate of €30 for technical staff in local government, these savings exceed €2.6 million per year.
  • Effectiveness savings are just as large at another 500 hours per month. Even considering only the efficiency benefits for 2006 (i.e. ignoring those that may have accrued in 2004-05, as well as the effectiveness benefits), the study indicates that the total investment to set up the IDEC and develop it over a four year period (2002-05) is recovered in just over 6 months.
  • Wider socio-economic benefits have also been identified but not quantified. In particular, the study indicates that web-based spatial services allow smaller local authorities to narrow the digital divide with larger ones in the provision of services to citizens and companies.

The study is methodologically heavy toward quantification of cost savings with some information pertaining to access to information and civicness associated to an increase in access to data.  It is mild on the latter, primarily because this is hardest and most subjective of measures.  But then again so is justice, equality and the good life.  I appreciate the quantification of costs, it makes the bean counters happy, I would however like to see more civicness measures and philosophical reasons for more access. I think that would lead to the creation of civic access measures.

btw – I have been a big fan of the editor of this report for years.

« Older entries § Newer entries »