Article written by: Kit Chokly & Tracey P. Lauriault
The phrase “flatten the curve” has recently come into the vernacular to encourage slowing the spread of COVID-19. The concept comes from the Centre for Disease Control (CDC) report (p.18), where the curve renders the daily number of COVID-19 infections on the Y-axis and the day these are counted on X-axis of a line chart. A flatter curve visually depicts when the illness is under control, while a higher peak curve emerges when the health case system becomes overwhelmed and instances of the virus are high. Together we work to “flatten the curve” by following the recommendations of our Chief Medical Officers of Health.
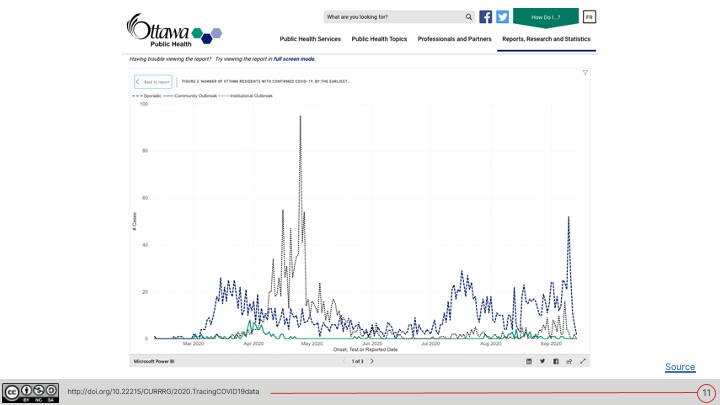
This is not the only visual metaphor used to refer to COVID-19, however; the “second wave” has also been used to describe the spread of COVID-19. This term refers to another peak in the line chart that may appear as restrictions are lifted and cases spike as a result. By visualizing health data, we can see the spread of COVID-19 and set public health goals through the peaks and valleys of a line chart.
In addition to demonstrating a growing public awareness of the pandemic, the popularity of these phrases shows the importance of data visualization in understanding—and thus managing and communicating—the virus. Following this prevalence, many official sources now share live data to track and communicate COVID-19 data. John Hopkins University, for example, rendered COVID-19 datasets into the first global and US dashboards. Health Canada provides an interactive map of Canada featuring case counts and rates. Some city public health departments such as Ottawa Public Health have also launched dashboards to communicate the current status of local COVID-19 cases.
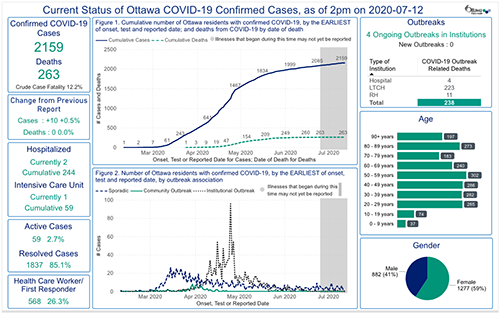
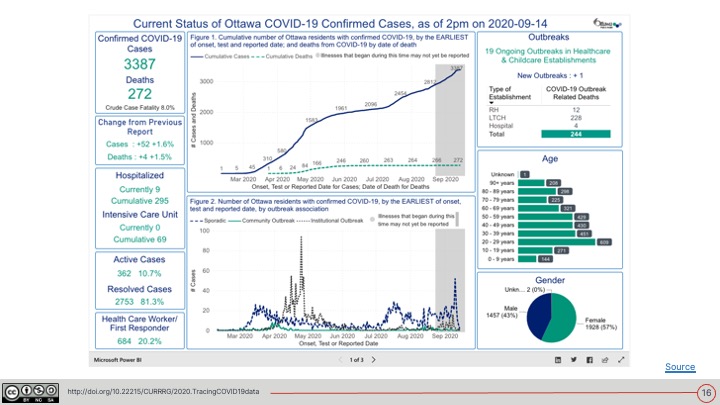
These dashboards get complex information across quickly and include many types of indicators. For instance, as seen below, the City of Ottawa dashboard includes key indicators such as the number of COVID-19 cases, hospitalization levels, and other case data. These are depicted in a cumulative curve of confirmed cases, their rate across time, bar charts of cases reported by age, and a pie chart that shows cases by gender. Visualizing these data in a dashboard makes it easy to see patterns and trends.
While the city and all the other public health agencies across Canada should be lauded for their dashboards, these, like all other demographic reporting systems, suffer from a lack of a nuanced and intersectional approach to collecting and reporting data. For example, this dashboard alongside those just mentioned do not report how COVID-19 affects people of low socio-economic status. They do not include how living in a densely populated area may also influence health outcomes. There is also little to no data on how COVID-19 may disproportionately affect racialized groups such as Indigenous, Black, and other people of colour. And most importantly, they do not demonstrate how all of these variables intersect. As Jamie Bartlett and Nathaniel Tkacz (2017) explain,
“Like all visualisations of data, dashboards necessarily distort the information that they are attempting to present neutrally by defining how a variable is to be understood and by excluding any data which isn’t compatible with this definition” (p. 15).
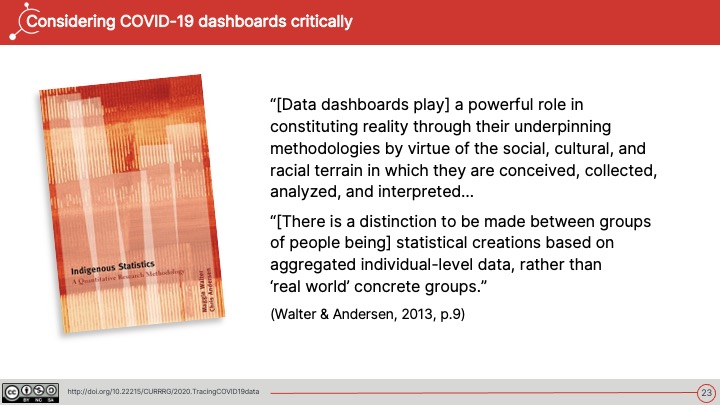
As Maggie Walter and Chris Andersen (2013) discuss in their book Indigenous Statistics, data dashboards—like all data and technological systems—are more than neutral numerics as they play,
“a powerful role in constituting reality through their underpinning methodologies by virtue of the social, cultural, and racial terrain in which they are conceived, collected, analyzed, and interpreted” (p. 9).
They also emphasize that there is a distinction to be made between groups of people being “statistical creations based on aggregated individual-level data, rather than ‘real world’ concrete groups” (Walter & Andersen, 2013, p.9).
It is not uncommon that dashboards miss these subtleties. We are only just coming to terms with the idea that data are not neutral objects, and that data dashboards are cultural artifacts. As such, they reflect the limitations of the normative values of the institutions that create them, of our health data collection systems, and of this very form of communication.
Overcoming these limitations means that we can improve the information environment of decision makers to target limited resources when and where they are needed most, while not reinforcing nor perpetuating inequality. Making things visible makes them actionable. Doing so also prevents the deep systemic societal problems that have led to such poor health outcomes for some during the pandemic. Below, we consider some ideas on how to re-think data and data dashboards by framing their creation with an intersectional design approach.
What is intersectionality?
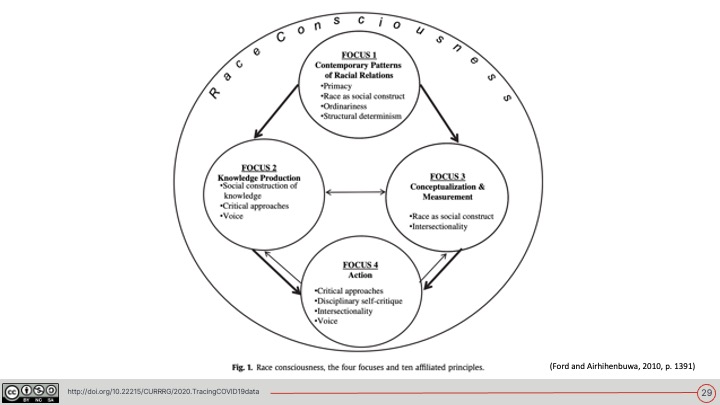
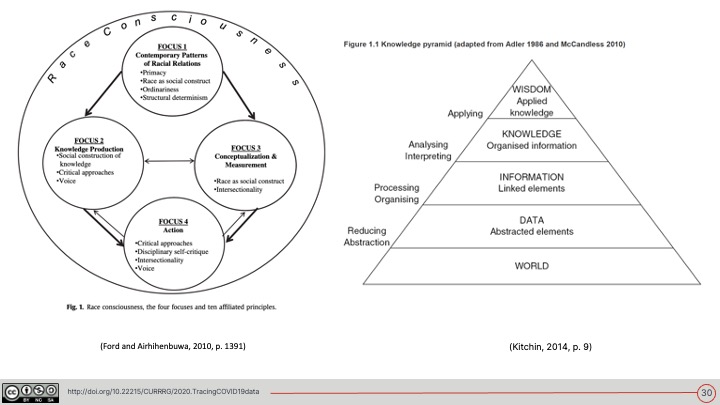
Intersectionality is a term conceptualized by Black feminist legal scholar Kimberlé Crenshaw in 1989. The concept has earlier roots in Black feminism and builds on the work and struggles of Sojourner Truth, Ida B. Wells, Louise Thompson Patterson, and Audre Lorde (to name only a few). Intersectionality refers to the notion that different forms of oppression interact with and multiply each other, demonstrating their inseparability. Health scientists Chandra Ford and Collins Airhihenbuwa (2010) write:
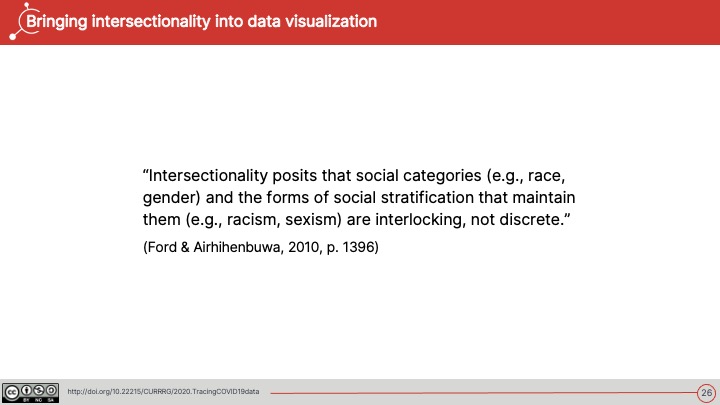
“Intersectionality posits that social categories (e.g., race, gender) and the forms of social stratification that maintain them (e.g., racism, sexism) are interlocking, not discrete” (p. 1396).
These scholars and social justice leaders emphasize that rather than adding these co-occurring categories together in public health research, it is essential that the interactions between categories are also considered (Ford & Airhihenbuwa, 2010). As an example of intersectional public health, Ford and Airhihenbuwa (2010) describe the importance of considering race alongside gender and sexuality when approaching HIV risk behaviours because of the way “racism operates via gendered and sexualized proscriptions” (p. 1394).
How does intersectionality relate to the Tracing COVID-19 Data project?
Epidemiologist Greta Bauer (2014) describes how datasets about public health and marginalized populations tend to only examine a singular axis of oppression, even though intersectional data reporting can help reduce health inequalities.
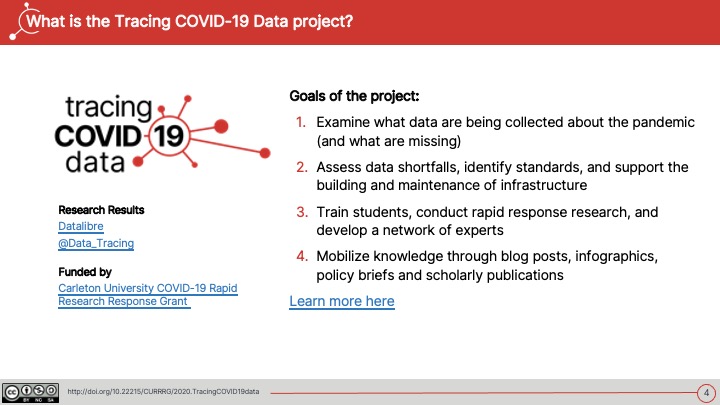
One of the aims of the Tracing COVID-19 Data project is to identify these asymmetries in COVID-19 data reports, as well as rapidly and effectively mobilizing this knowledge and communicating our findings with decision makers. As demonstrated by the growing use of dashboards in reporting COVID-19 data, data visualization can be a useful communication tool. We thus ask:
How can we communicate COVID-19 data in a way that improves health outcomes for all? How can we use data visualization techniques to communicate intersectional issues effectively?
We aim to provide answers to questions such as these for those responsible for official COVID-19 reporting. Our hope is that our recommendations will lead to an intersectional approach to communicating COVID-19 impacts and health outcomes.
How have people tried to visualize intersectionality already?
Visual metaphors are useful to describe intersectionality. Crenshaw (1989) herself uses the metaphor of the traffic intersection, writing:
“Discrimination, like traffic through an intersection, may flow in one direction, and it may flow in another. If an accident happens in an intersection, it can be caused by cars traveling from any number of directions and, sometimes, from all of them. Similarly, if a Black woman is harmed because she is in the intersection, her injury could result from sex discrimination or race discrimination (p. 149).”
In another metaphor, provided by Black feminist scholar Patricia Hill Collins (1990) is the “matrix of domination”. Here, she uses a multi-level matrix to describe how oppression—and privilege—must be understood through an interlocking structural model (Hill Collins, 1990).
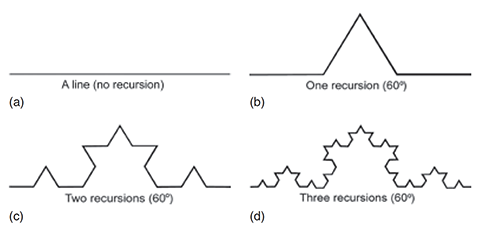
More recently, communications scholars Jenna Abetz and Julia Moore (2019) describe how visual metaphors for intersectionality often focus on centralizing difference and are often conceptualized as linear. They suggest the use of fractals—repeating and irregular geometric patterns—as a metaphor for the scalability and recursion of oppression (Abetz & Moore, 2019).
The issue with metaphors
While these visual metaphors are extremely useful to conceptualize intersectionality, Bauer (2014) points to the issue with their use in quantitative research. She writes:
“Interestingly, quantitative applications of intersectionality can be obfuscated by the predominance of mathematical-like language in intersectionality theory, though its use there is conceptual rather than strictly mathematical” (Bauer, 2014, p. 12).
While illustrations of traffic intersections, graphic matrices, and fractal patterns can be used to explain intersectionality, they do not easily map onto the visualization of quantitative data in a data dashboard and can actually obscure the meanings of these data. They may, however, be useful instruments to help model which data should be collected and rendered visually.
Feminist Data Visualization
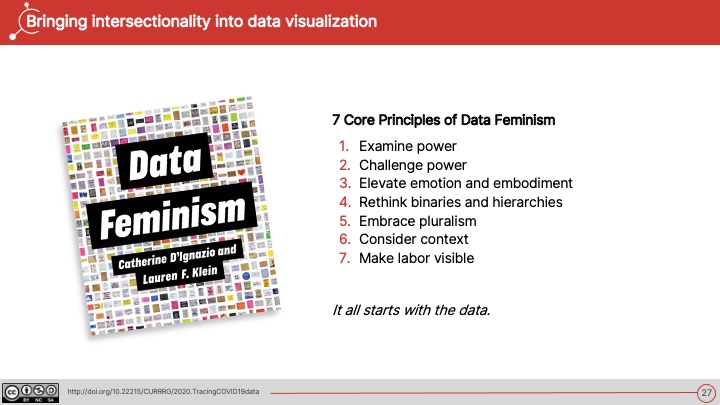
To address this issue, data scientists Catherine D’Ignazio and Lauren Klein (2016) suggest applying feminist theory to data visualization. Rather than resign ourselves to the limitations of current dashboards, feminist data visualzation offers the possibility of “challeng[ing] the validity of a variety of binaristic and hierarchical configurations” (D’Ignazio & Klein, 2016, p. 1). This includes non-intersectional data analysis.
D’Ignazio and Klein (2016) thus suggest that data visualization begins with the way data are collected and organized—even before they are visualized.
This means starting with the evidence collected and finding the best way to get the stories they tell across. This could mean enlisting the help of metaphors; however, it is important to find the stories from the data first and then use metaphor to communicate them as effectively as possible.
To find and interpret these data stories, D’Ignazio and Klein (2016) offer six starting principles:
- Rethink binaries
- Embrace pluralism
- Examine Power and Aspire to Empowerment
- Consider Context
- Legitimize Embodiment and Affect
- Make Labor Visible
Finding and using intersectional data
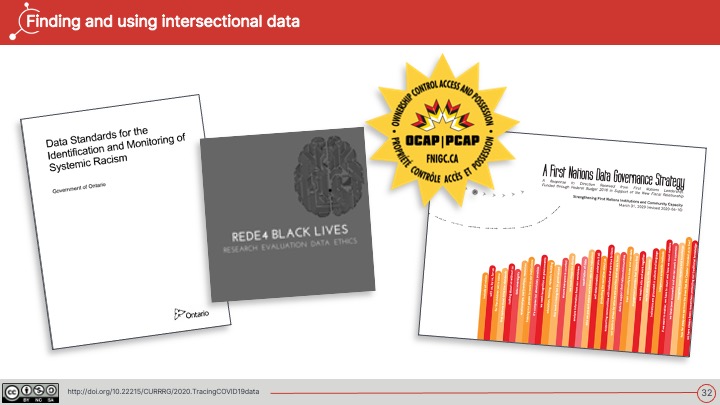
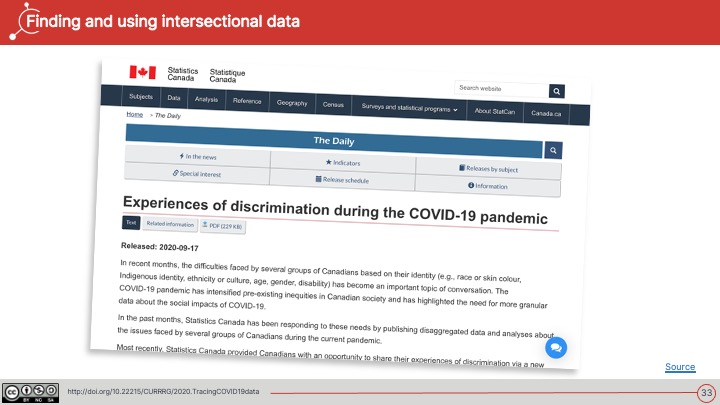
Despite the lack of intersectional data in current COVID-19 dashboards, a number of organizations are already making efforts to find and use intersectional data. The Data Standards for the Identification and Monitoring of Systemic Racism, produced by the Ontario Anti-Racism Directorate, not only takes an intersectional approach to the collection of data and data characteristics, but uses it to identify and monitor systemic racism. These ideals align with the Research, Evaluation, Data Collection, and Ethics (REDE) Protocol for Black Populations in Canada Protocol (or the REDE4BlackLives Protocol for short), which also suggests that these data should be part of ongoing conversations in pre-existing communities.
This is not unlike the work of:
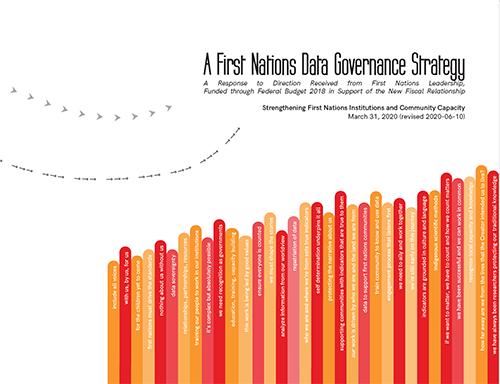
- the First Nations Information Governance Council (FNIGC) on defining principles of Ownership, Control, Access and Possession (OCAP), which state that there should be “nothing about us without us”.
- Similarly, the Global Indigenous Data Alliance (2019) also advocates for Indigenous data sovereignty, which “reinforces the rights to engage in decision-making in accordance with Indigenous values and collective interests” (p. 1).
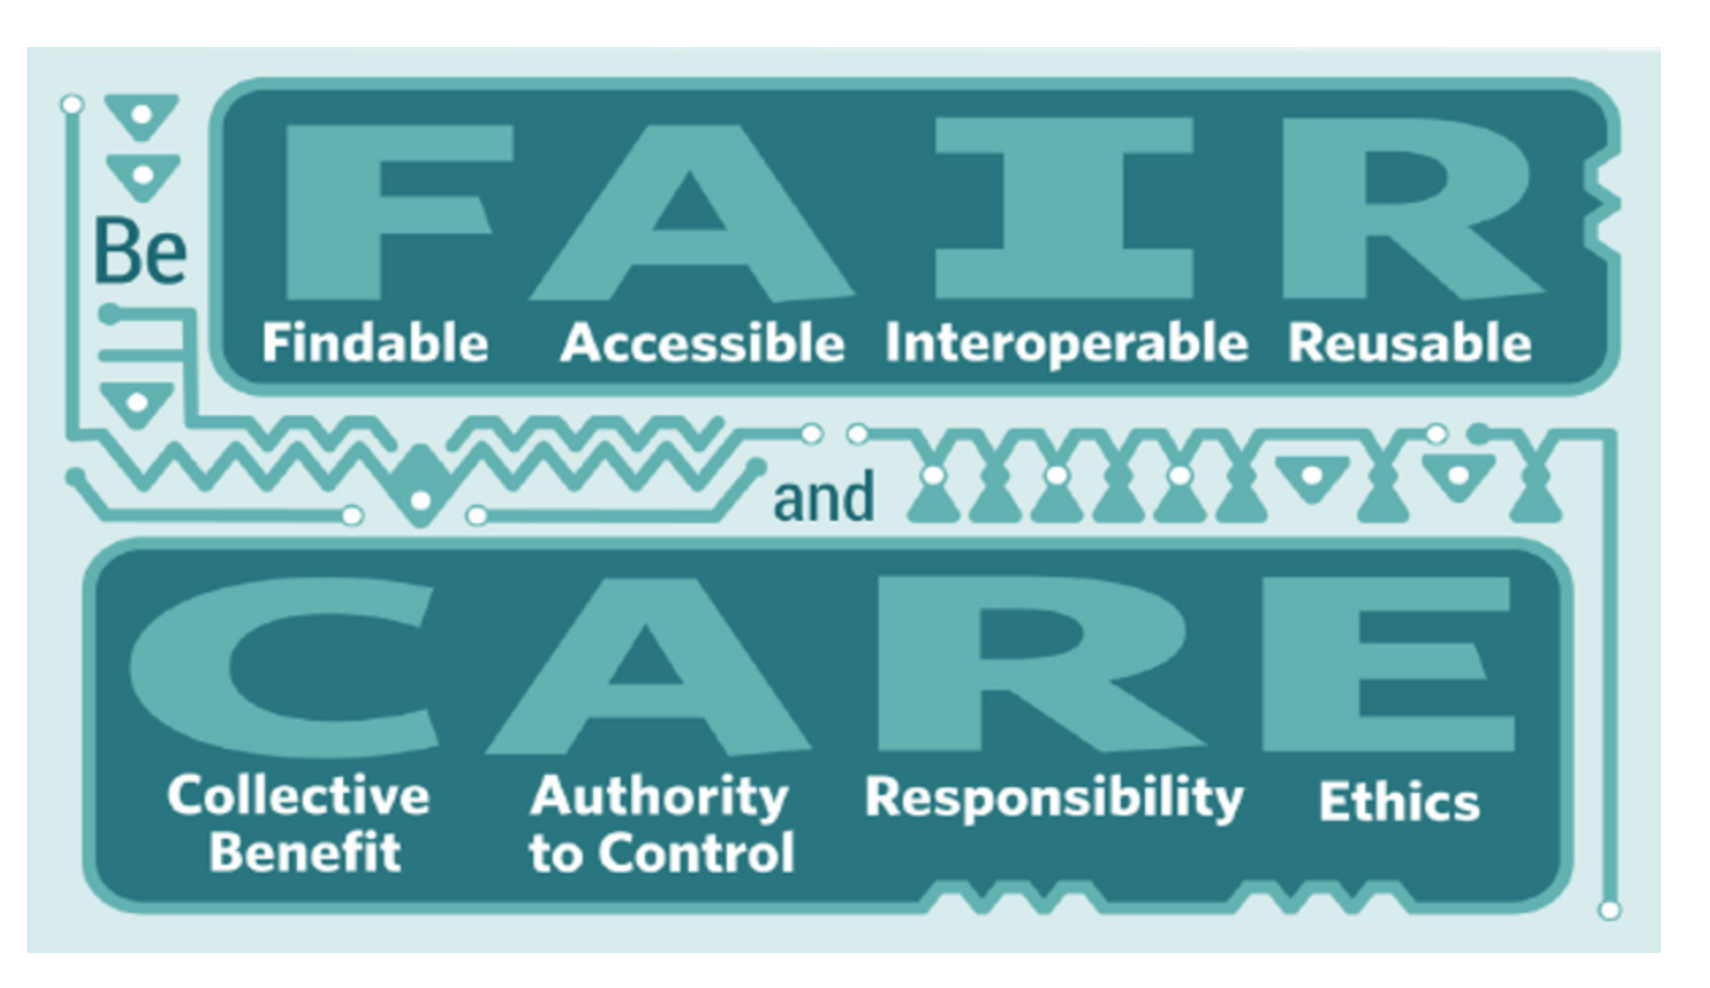
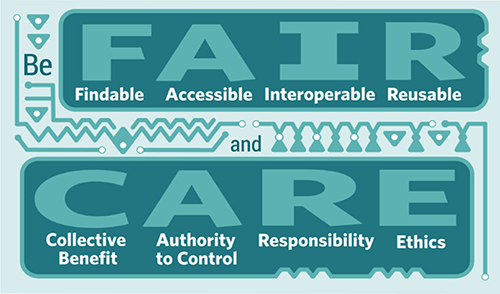
- This sovereignty can be encouraged by following the CARE Principles, which focus on the [C]ollective benefit of data, recognize the [A]uthority of Indigenous People to control their own data, shows [R]esponsibility to support their self-determination, and keeps [E]thics at the forefront of all data projects.
- Furthermore, they are designed to work with existing FAIR principles of open data.
The Tracing COVID-19 Data project is working to bring together some of these datasets as they pertain to COVID-19. For example, with the help of Aidan Battley, we are looking into social models of disability and data such as the International Classification of Functioning, Disability and Health (ICF) by the World Health Organization (WHO). These models and data fall well into the intentions of this project, which is to encourage technological citizenship and a rights based approach to data during a crisis. Alongside collecting these data, visualization is key to reach our goals.
But how do we align these principles, protocols, standards, and practices? How might one model these in a population health data system? And how should these data be rendered visually? These are challenges worth pursuing, as lives are quite literally on the line.
What efforts might be useful to adapt for the Tracing COVID-19 Data project?
Following these principles, protocols, standards and practices, the Tracing COVID-19 Data project is critically thinking about data and data systems. We are currently collecting data from all over the country, including data on the way location, age, ability, race, Indigeneity, gender, and income may intersect with COVID-19 outcomes. From there, we aim to develop a series of rapid and archivable visualizations and blog posts to communicate our findings in ways best suited to both researchers and the communities they describe, as well as provide recommendations to decision makers on how to improve their data dashboards and other data visualizations techniques.
We are also mindful of becoming flexible and adaptable to new solutions (and issues) as they arise. The work of visualizing the intersectional impacts of COVID-19 is important, but loses its value if it becomes too brittle to be used effectively. We have already heard words of caution from racialized communities who rightfully fear becoming further stigmatized by being described through COVID-19 data. Listening to and working with the communities who are being multiply impacted by COVID-19 is critical to the success of this project. For this work to truly be intersectional, it is essential that we are all on board to listen and work together.
Slides from a presentation given on this topic (Sept 22, 2020)
References, Links, & Resources
Abetz, J., & Moore, J. (2018). Visualizing intersectionality through a fractal metaphor. In J. Dunn & J. Manning (Eds.), Transgressing Feminist Theory And Discourse (1st ed., pp. 31–43). Routledge. https://doi.org/10.4324/9781351209793-3
Bartlett, J., & Tkacz, N. (2017). Governance by Dashboard. https://core.ac.uk/download/pdf/80851285.pdf
Bauer, G. R. (2014). Incorporating intersectionality theory into population health research methodology: Challenges and the potential to advance health equity. Social Science & Medicine, 110, 10–17. https://doi.org/10.1016/j.socscimed.2014.03.022
Centre for Disease Control. (2007). Interim Pre-pandemic Planning Guidance: Community Strategy for Pandemic Influenza Mitigation in the United States. 97. https://www.cdc.gov/flu/pandemic-resources/pdf/community_mitigation-sm.pdf
Columbia Law School. (2017, June 8). Kimberlé Crenshaw on Intersectionality, More than Two Decades Later. https://www.law.columbia.edu/news/archive/kimberle-crenshaw-intersectionality-more-two-decades-later
Crenshaw, K. (1989). Demarginalizing the Intersection of Race and Sex: A Black Feminist Critique of Antidiscrimination Doctrine, Feminist Theory and Antiracist Politics. University of Chicago Legal Forum, 1989(1), 31. https://chicagounbound.uchicago.edu/cgi/viewcontent.cgi?article=1052&context=uclf
D’Ignazio, C., & Klein, L. F. (2016). Feminist Data Visualization. 5. http://www.kanarinka.com/wp-content/uploads/2015/07/IEEE_Feminist_Data_Visualization.pdf
First Nations Information Governance Centre. (2020). The First Nations Information Governance Centre. https://fnigc.ca/index.php
Ford, C. L., & Airhihenbuwa, C. O. (2010). The public health critical race methodology: Praxis for antiracism research. Social Science & Medicine, 71(8), 1390–1398. https://doi.org/10.1016/j.socscimed.2010.07.030
Fundamentals of OCAP®. (2020). The First Nations Information Governance Centre. https://fnigc.ca/training/fundamentals-ocap.html
Gilyard, K. (2017). Louise Thompson Patterson: A Life of Struggle for Justice. Duke University Press. https://www.dukeupress.edu/louise-thompson-patterson
Government of Canada. (2020, July 8). Coronavirus disease (COVID-19): Outbreak update. https://www.canada.ca/en/public-health/services/diseases/2019-novel-coronavirus-infection.html
Government of Ontario. (2016, June 28). Anti-Racism Directorate. https://www.ontario.ca/page/anti-racism-directorate
Government of Ontario. (2019, August 27). Data Standards for the Identification and Monitoring of Systemic Racism. https://www.ontario.ca/document/data-standards-identification-and-monitoring-systemic-racism
Government of Ontario. (2020, July 8). COVID-19 (coronavirus) in Ontario. https://covid-19.ontario.ca/
Greenwood, F., Howarth, C., Poole, D. E., Raymond, N. A., & Scarnecchia, D. P. (2017). The Signal Code: A human rights approach to information during crisis. Harvard Humanitarian Initiative. https://hhi.harvard.edu/publications/signal-code-human-rights-approach-information-during-crisis#:~:text=The%20Signal%20Code%20is%20the,have%20to%20information%20during%20disasters.
Hill Collins, P. (1990). Black feminist thought: Knowledge, consciousness, and the politics of empowerment. Unwin Hyman. http://www.hartford-hwp.com/archives/45a/252.html
John Hopkins University. (2020, July 8). COVID-19 Map—Johns Hopkins Coronavirus Resource Center. https://coronavirus.jhu.edu/map.html
Lauriault, T. (2020, June 1). Tracing COVID-19 Data: Data and Technological Citizenship during the COVID-19 Pandemic. Datalibre. Retrieved 8 July 2020, from https://www.datalibre.ca/2020/06/01/tracing-covid-19-data-data-and-technological-citizenship-during-the-covid-19-pandemic/
Lorde, A. (1981). The Uses of Anger: Women Responding to Racism. BlackPast. https://www.blackpast.org/african-american-history/speeches-african-american-history/1981-audre-lorde-uses-anger-women-responding-racism/
National Underground Railroad Freedom Center. (n.d.). Ida B. Wells. Retrieved 8 July 2020, from https://freedomcenter.org/content/ida-b-wells
Ottawa Public Health. (2020, July 8). Daily COVID-19 Dashboard. https://www.ottawapublichealth.ca/en/reports-research-and-statistics/daily-covid19-dashboard.aspx
Podell, L. (n.d.). The Sojourner Truth Project. The Sojourner Truth Project. Retrieved 8 July 2020, from https://www.thesojournertruthproject.com
Research Data Alliance International Indigenous Data Sovereignty Interest Group. (2019). CARE Principles for Indigenous Data Governance. The Global Indigenous Data Alliance. https://static1.squarespace.com/static/5d3799de845604000199cd24/t/5da9f4479ecab221ce848fb2/1571419335217/CARE+Principles_One+Pagers+FINAL_Oct_17_2019.pdf
The First Nations Information Governance Centre. (2020). A First Nations Data Governance Strategy. https://fnigc.inlibro.net/cgi-bin/koha/opac-retrieve-file.pl?id=9c677f3dcf8adbf18fcda96c6244c459
The Protocol: REDE4BlackLives. (n.d.). REDE4BlackLives. Retrieved 8 July 2020, from https://rede4blacklives.com/the-protocol/
Walter, M. (2013). Indigenous statistics: A quantitative research methodology. Left Coast Press. https://www.routledge.com/Indigenous-Statistics-A-Quantitative-Research-Methodology/Walter-Andersen/p/book/9781611322934
Wilkinson, M. D., Dumontier, M., Aalbersberg, Ij. J., Appleton, G., Axton, M., Baak, A., Blomberg, N., Boiten, J.-W., da Silva Santos, L. B., Bourne, P. E., Bouwman, J., Brookes, A. J., Clark, T., Crosas, M., Dillo, I., Dumon, O., Edmunds, S., Evelo, C. T., Finkers, R., … Mons, B. (2016). The FAIR Guiding Principles for scientific data management and stewardship. Scientific Data, 3(1), 160018. https://doi.org/10.1038/sdata.2016.18
World Health Organization. (2018, March 2). International Classification of Functioning, Disability and Health (ICF). https://www.who.int/classifications/icf/en/
World Health Organization. (2020). https://www.who.int


Comments on Posts